Fig. 1.
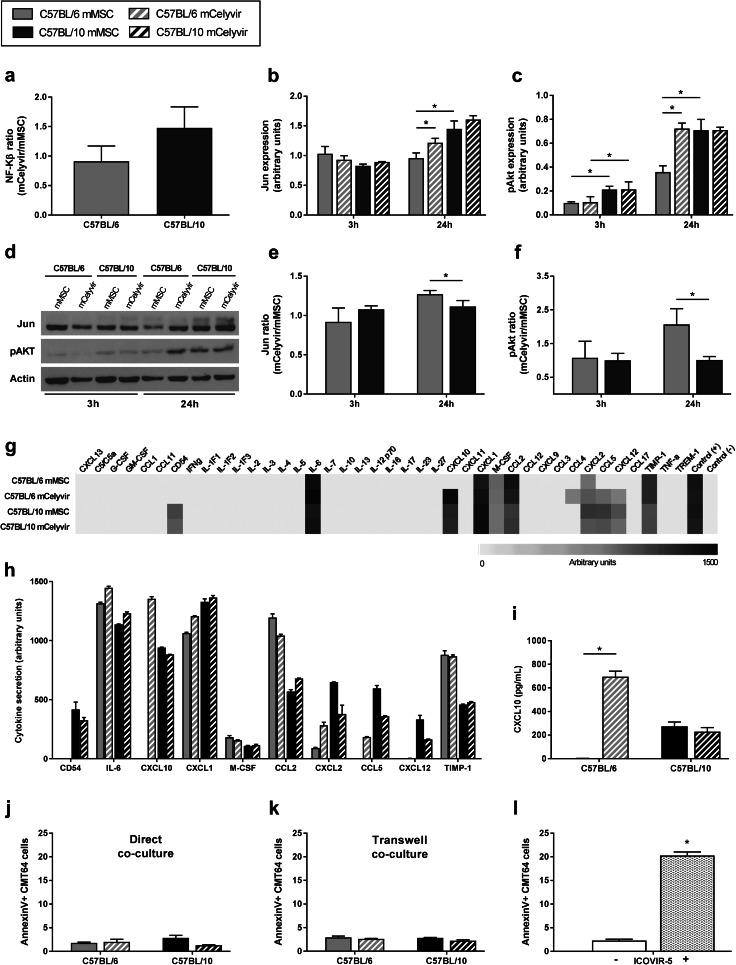
C57BL/6 and C57BL/10 cells present similar molecular signaling and cytokine profile secretion after infection with ICOVIR-5. a mCelyvir/mMSC expression ratio of NF-κB by luciferase reporter system in C57BL/6 and C57BL/10 cells. b–d Expression of Jun and pAkt in C57BL/6 and C57BL/10 cells at 3 and 24 h after infection with ICOVIR-5 by Western blot. e, f mCelyvir/mMSC expression ratio of Jun and pAkt. g Secretion pattern of pro-inflammatory cytokines of mMSC and mCelyvir at 24 h. The grey code indicates arbitrary units of expression with white representing absence of secretion and black representing the highest secretion. h Bars represent the mean secretion in arbitrary units of secreted cytokines. i ELISA analysis of CXCL10 secretion levels in supernatants collected at 24-h post-infection. j, k Apoptosis in CMT64-6 cells after direct or transwell co-culture with mMSC or mCelyvir at 72 h. l Apoptosis in mock- and ICOVIR-5 infected CMT64-6 cells at 72 h. Grey color represents C57BL/6 cells, while dark color represents C57BL/10 cells. Solid bars represent non-infected cells (mMSC), while stripped bars represent ICOVIR-5-infected cells (mCelyvir). *p < 0.05 (Wilcoxon test)

