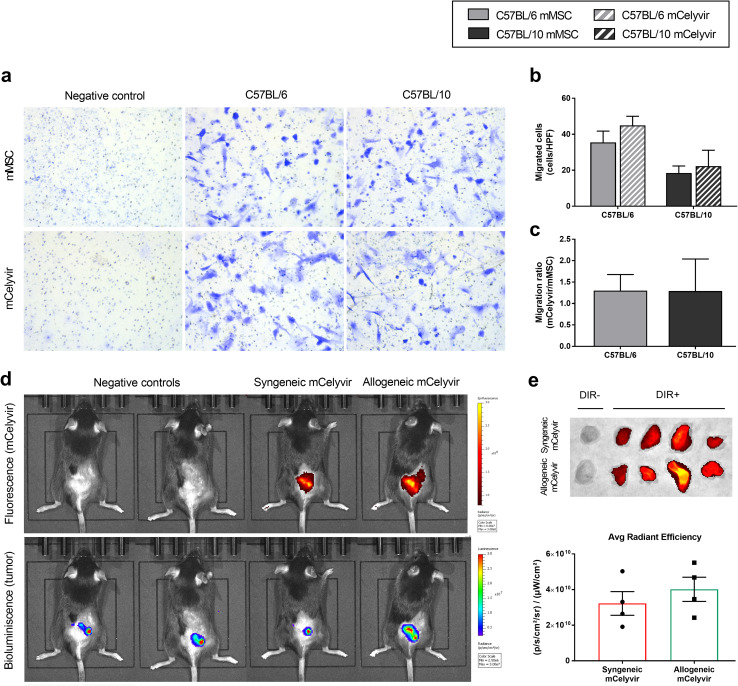
Fig. 2.
C57BL/6 and C57BL/10 mMSC and mCelyvir home to tumor site. a Migration of mMSC and mCelyvir cells toward CMT64-6 tumor cells was evaluated in vitro by transwell migration assay at 24 h. mMSC in the presence of DMEM alone was used as negative control. Images correspond to 40X high-power field. b Quantification of migrated cells per high-power field (cells/HPF) at 24 h. c mCelyvir/mMSC migration ratio of C57BL/6 and C57BL/10 cells at 24 h. *p < 0.05 (Wilcoxon test). d In vivo homing of syngeneic (C57BL/6) and allogeneic (C57BL/10) mCelyvir to tumor site after i.p. administration. DIR-fluorescence detects mCelyvir, while bioluminescence detects CMT64-Luc tumors. e Fluorescence signal (DIR+) in tumors was quantified ex vivo as Average (Avg) Radiant Efficiency at 48 h. Unlabeled syngeneic and allogeneic mCelyvir (DIR-) were used as negative control. Grey color represents C57BL/6 cells, while dark color represents C57BL/10 cells. Solid bars represent non-infected cells (mMSC), while stripped bars represent ICOVIR-5-infected cells (mCelyvir). *p < 0.05 (Mann–Whitney U test)

