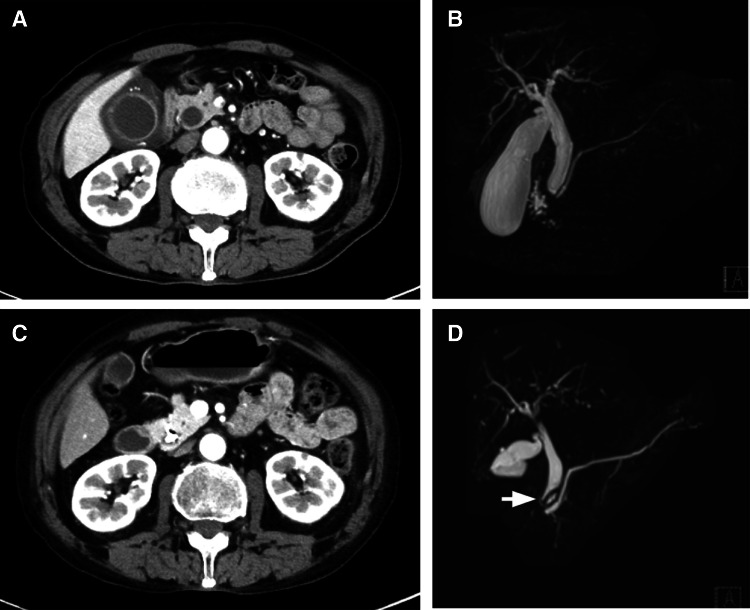
Fig. 1.
Computed tomography (CT) image obtained on day 24 shows wall thickening of the gallbladder and obstruction of the lower portion of the bile duct (a). Magnetic resonance cholangiopancreatography (MRCP) image obtained on the same day shows narrowing of the bile duct (b). Follow-up CT image on day 134 (c) and MRCP image obtained on day 151 (d) show resolution of bile duct dilation. The stent is observed as a signal defect (arrow)

