
Fig. 1.
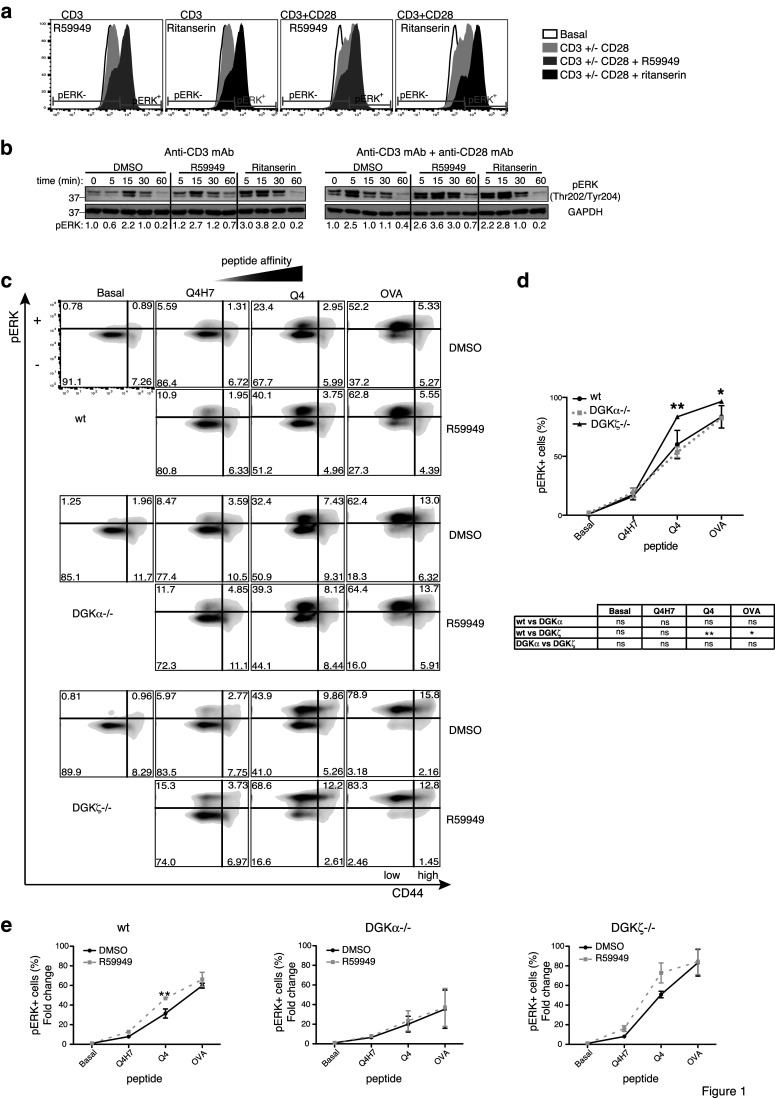
DGK control of the ERK axis. a Phosphoflow analysis of ERK phosphorylation in Jurkat T cells stimulated with anti-CD3 or -CD3/CD28 mAb, alone or with the DGKi. The percentage of pERK+ cells is shown. b Cells were stimulated as in a and pERK evaluated by western blot. Normalized values for pERK/GAPDH ratios are indicated beneath the blots. Values were normalized to the unstimulated time point = 1.0. c–e Splenocytes from wt or DGK−/− OT-I transgenic mice were stimulated with the indicated peptides, with DMSO or R59949. ERK1/2 phosphorylation and CD44 expression were determined by flow cytometry. c Representative biparametric analysis of CD44+ and pERK+ in CD8+ cells of each genotype. d Percentage of pERK+ cells in the CD44low population for the three genotypes. e Effect of R59949 on the percentage of pERK+ cells in each genotype was determined after normalization to basal conditions. Results summarize two experiments (n = 3/genotype). c–e Data were analyzed using two-way ANOVA and Bonferroni post-test. Significant differences are indicated