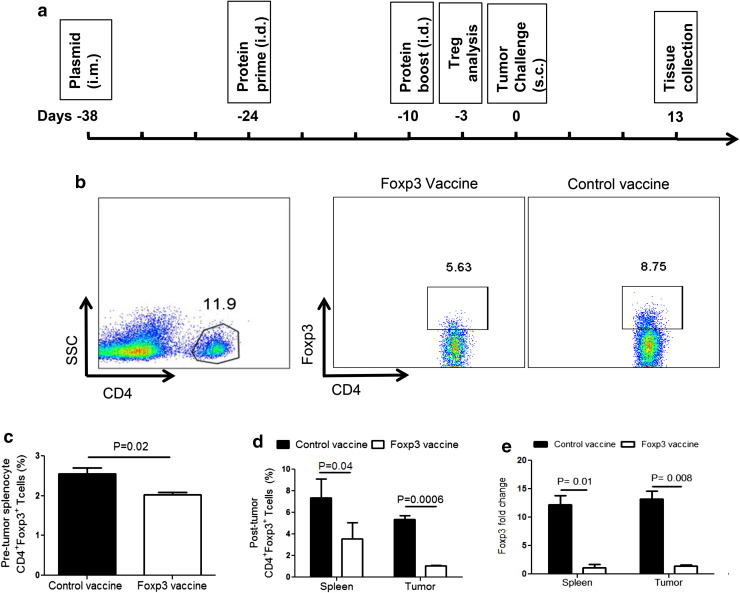
Fig. 2.
Foxp3 vaccine reduces CD4+Foxp3+ Treg. a Schematic representation of vaccination and tumor challenge timeline. C57BL/6 mice (n = 11 per group) were immunized i.m. with pEGFP-N1 or Fox-GFP plasmids on day − 38. Mice were then injected i.d. with molecular grade bovine serum albumin or Foxp3 recombinant protein emulsified in IFA on days − 24 and − 10, as a prime-boost regimen. A week after the boost injection, mice (n = 3 per group) was sacrificed and examined for the frequency of CD4+Foxp3+ T cells in splenocytes before tumor challenge. On day 0, B16F10 tumor cell line was injected s.c., and on day 13, the final analyses were assessed on spleens and tumors of mice (n = 3 mice per group). b Representative dot plots showing the frequency of CD4+Foxp3+ T cells in splenocytes and cells isolated from tumor tissues. c Percentages of CD4+Foxp3+ T cells in splenocytes before tumor challenge. d Percentages of CD4+Foxp3+ T cells in spleen and tumor tissue obtained from Foxp3 vaccinated versus control mice 13 day post-tumor challenge. e Foxp3 gene expression in splenocytes and tumor tissues of Foxp3 vaccinated versus control mice 13 day post-tumor challenge (β-actin was used as housekeeping gene). Data represent mean ± one standard error of two independent experiments

