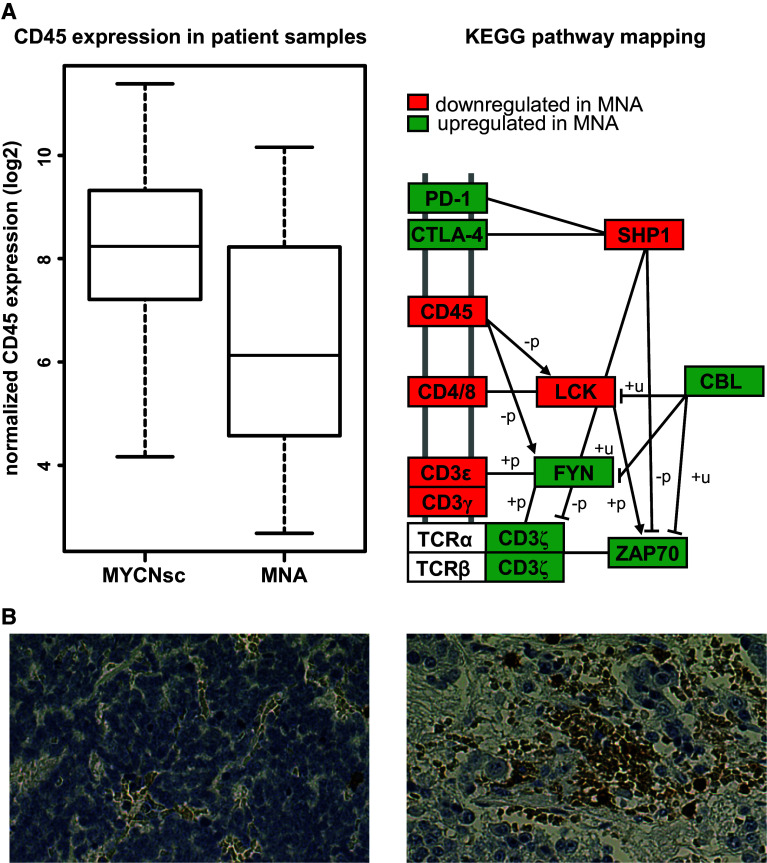
Fig. 1.
MYCN and leukocyte infiltration in neuroblastoma tissue. a MYCN and CD45 mRNA expression was analyzed by Affymetrix HuEx1.0 arrays in 101 NB patients (left panel). The difference of CD45 mRNA expression in MYCN-amplified patients (MNA; n = 19) compared to MYCN single copy cases (MYCNsc; n = 82) was statistically significant (p = 0.005). KEGG pathway mapping of corresponding transcriptomes shows up (green)- and down (red)-regulated genes involved in T cell signaling, and “+p” and “−p” depict phosphorylation and dephosphorylation, respectively, while “+u” denotes ubiquitination (right panel). b CD45 staining of representative samples from MNA (left) and MYCN single copy (right) tumor tissue (×40 magnification)

