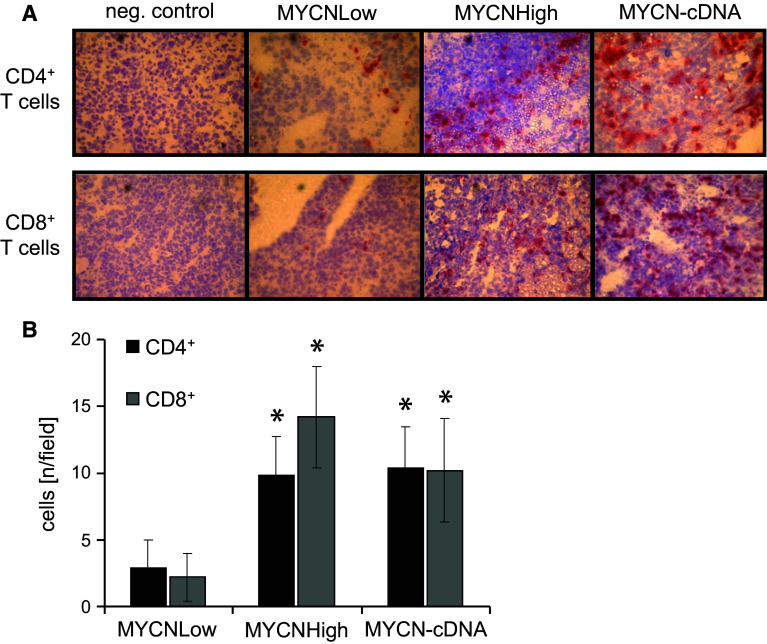
Fig. 4.
Analysis of tumor-infiltrating CD4+ and CD8+ lymphocytes. a Tumors of each immunized mouse were stained. Red staining indicates infiltration with CD4+ T cells (upper row) and CD8+ T cells (lower row), respectively. b Numbers of CD8+ T cells (gray bars) and CD4+ T cells (black bars) per field were determined by light microscopy (ten fields, ×40 magnification, mean value ± SD) (*p < 0.05)

