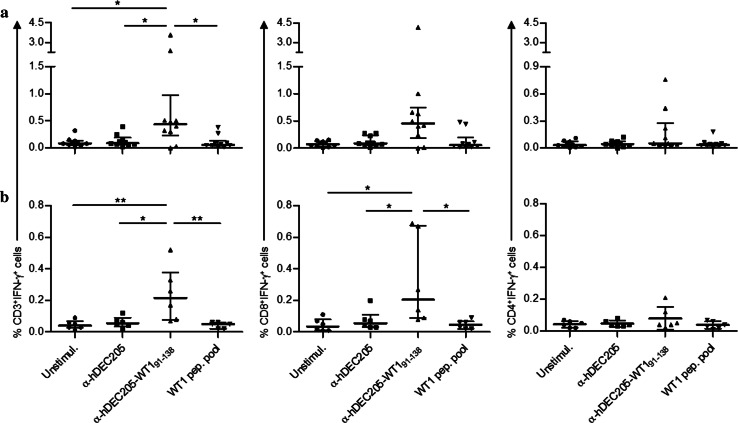
Fig. 4.
Summary of IFN-γ ICS results obtained from a all patients (n = 10) and b healthy individuals (n = 6). Plots show frequencies of IFN-γ+CD3+ (top), IFN-γ+CD8+ (middle), and IFN-γ+CD4+ (bottom) T-cells. Each data point represents one individual, bars indicate median frequencies with IQR, Tukey’s test *p < 0.05; **p < 0.01

