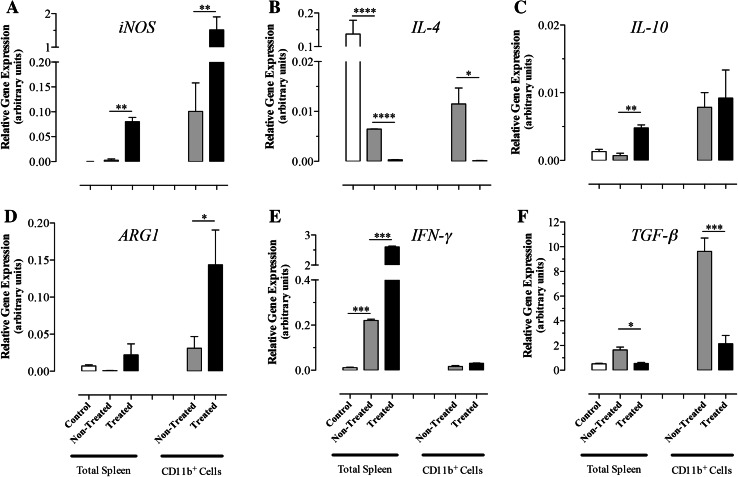
Fig. 4.
Relative expression levels of iNOS (a), IL-4 (b), IL-10 (c), ARG1 (d), IFN-γ (e), and TGF-β (f) mRNA isolated from whole spleen or splenic myeloid cells. Cells were obtained from normal (control group) or B16.F1-bearing mice at day 8 post-injection with Salmonella (treated group) or saline (non-treated group). Each data point represents the mean ± SEM of 6 (total spleens) or 3 (CD11b+ cells) mice per group. Asterisks denote statistically significant differences between the indicated groups (***p < 0.001; **p < 0.01; *p < 0.05). The results are representative of three independent experiments

