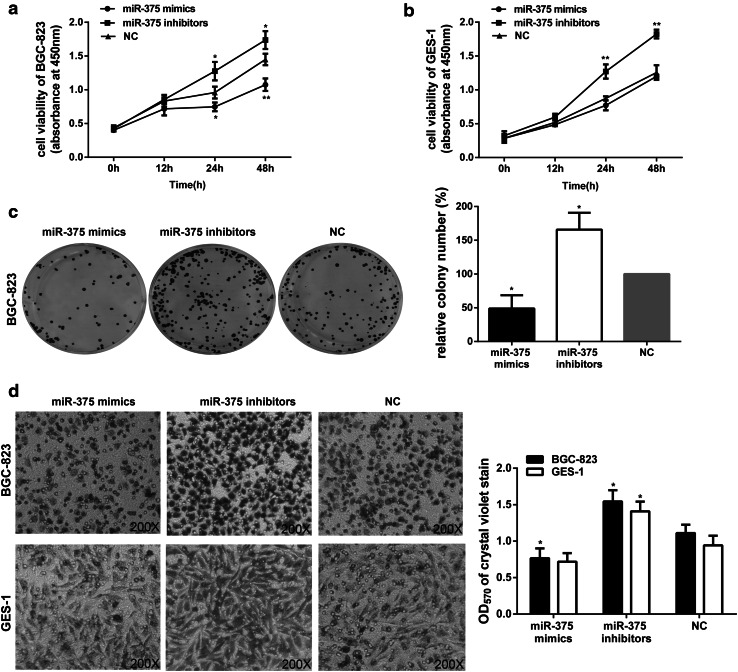
Fig. 2.
The effects of miR-375 expression on cell proliferation and migration in GES-1 and BGC-823 cells. a, b BGC-823 (a) and GES-1 (b) cells treated with the indicated oligonucleotides (miR-375 mimics, inhibitors, and NC) at 100 nM were subjected to CCK-8 assays at the indicated time points. c The colony numbers of BGC-823 cells were detected after transfection of the indicated oligonucleotides. The relative percentage of the NC group is designated as 100 %. d The migratory ability of BGC-823 and GES-1 cells was evaluated by transwell assays after transfection of the indicated oligonucleotides. Representative image fields of the migratory cells on the membrane stained with crystal violet (×200), and OD570 of crystal violet stain was determined to quantify the transwell assays. The data are represented as the mean ± SD of triplicate samples, *P < 0.05, **P < 0.01 versus the control group

