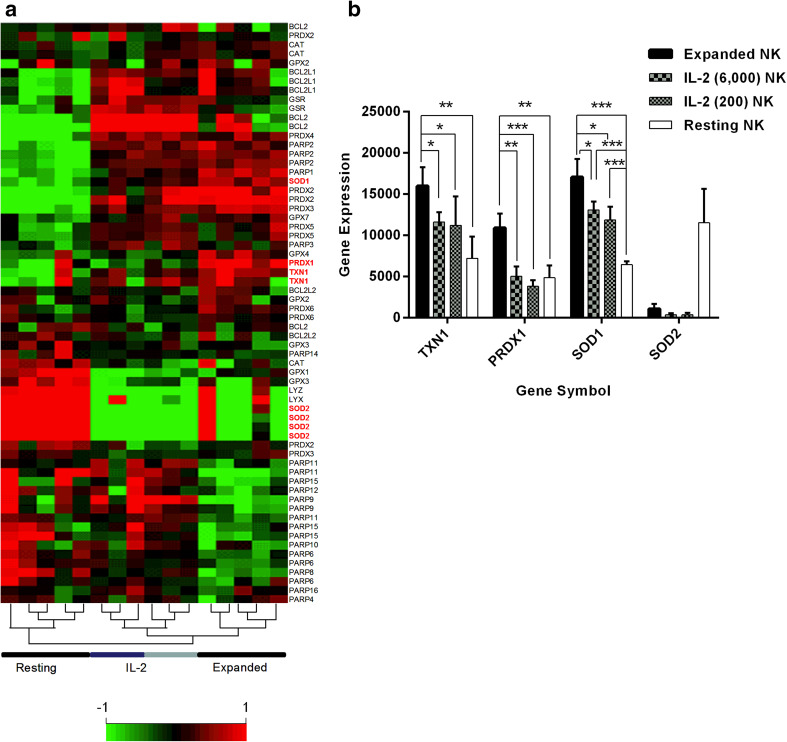
Fig. 2.
Gene expression array of resting NK, IL-2 NK and expanded NK. a Resting NK (n = 5) were evaluated immediately after immunomagnetic separation of CD56 + CD3-cells. IL-2 NK (n = 6) and expanded NK (n = 5) were evaluated after 7 days of coculture. For the IL-2 NK, two concentrations of IL-2 were used: 200 IU/mL (n = 3) and 6000 IU/mL (n = 3). A representative heat map showed three major clusters derived from the unsupervised hierarchical clustering analysis, namely resting NK, IL-2 NK, and expanded NK samples. IL-2 NK samples were in one cluster comprising of two IL-2 concentrations used (dark blue, 200 IU/mL; light blue, 6000 IU/mL). b A representative bar graph shows the gene expression of four anti-oxidant genes, namely TXN1, PRDX1, SOD1, and SOD2, selected from the microarray data. Comparisons were made for TXN1, PRDX1, SOD1 between each group of NK cells with expanded NK versus IL-2 NK; expanded NK versus resting NK; IL-2 NK versus resting NK. No comparison was made for SOD2 since the expression showed opposite pattern. ***p < 0.001, **p < 0.01, *p < 0.05

