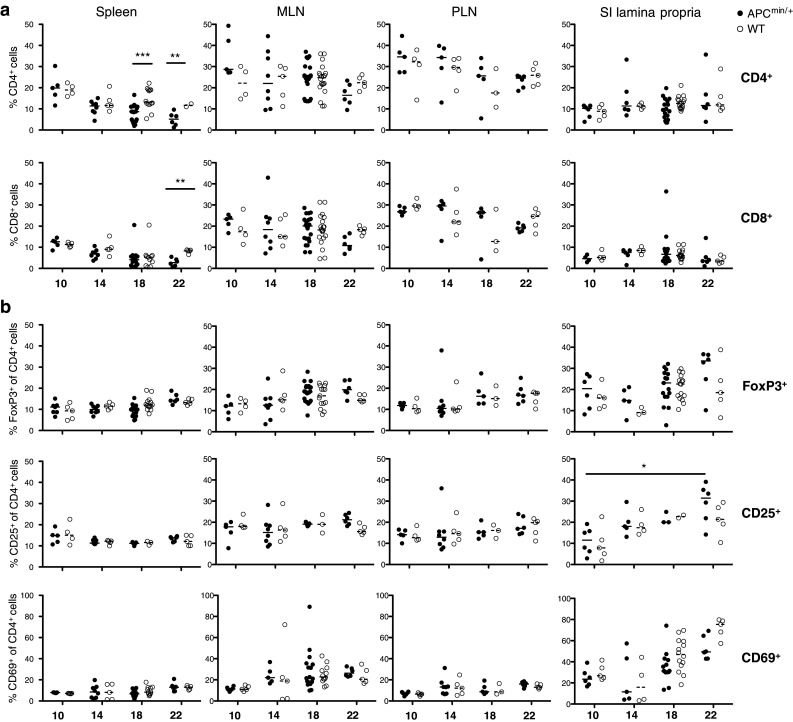
Fig. 1.

Lymphocytes frequencies in spleen, MLN, PLN and small intestine in both APCMin/+ and WT mice. The frequencies of CD8+ and CD4+ T cells (a), as well as CD4+CD69+, CD4+CD25+ and CD4+FoxP3+ (b) cells from spleen, MLN, PLN and small intestinal lamina propria were analyzed by flow cytometry at 10, 14, 18 and 22 weeks of age. Symbols represent individual mice (black APCMin/+, white WT), and lines represent median. Mann–Whitney test was used for statistical analysis *p < 0.05; **p < 0.01; ***p < 0.001
