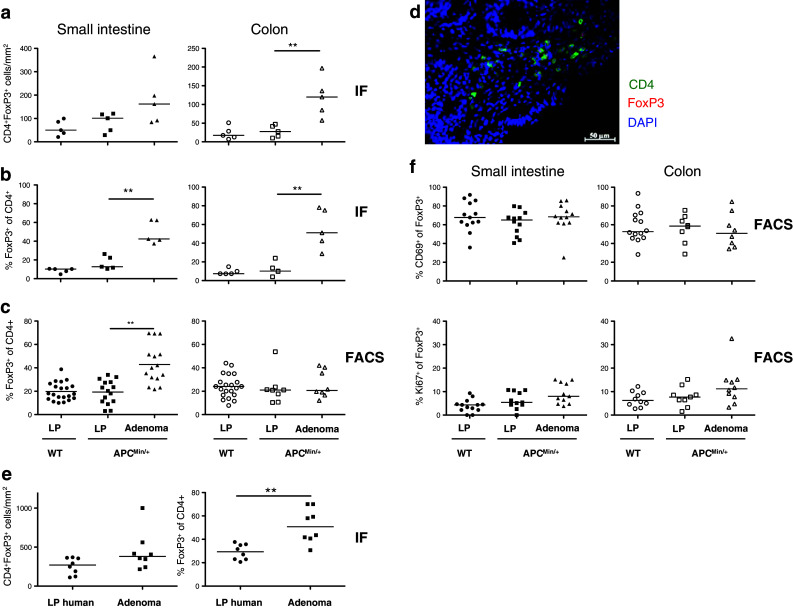
Fig. 4.

Regulatory T cells in murine and human unaffected intestinal tissue and adenomas. The frequencies of CD4+FoxP3+ Treg were determined by immunofluorescence (IF) and FACS in small intestinal and colon lamina propria (LP) from APCMin/+ and WT mice and in APCMin/+ adenomas, and by IF in human colon adenomatous polyps and unaffected tissue. Frequencies of CD4+FoxP3+ T cells are expressed as the number of cells per mm2 (a) or as percentage of FoxP3+ Treg among all CD4+ cells (b). c FACS analysis of CD4+FoxP3+ Treg in unaffected LP from WT mice and LP and adenoma from APCMin/+ mice. d Representative picture showing immunofluorescence staining of CD4 (green) and FoxP3 (red) in murine small intestinal adenoma section. Nuclei are stained blue with DAPI. e Frequencies of CD4+FOXP3+ T cells in human adenomatous polyps patients. f Frequencies of CD69+ and Ki67+ among CD4+FoxP3+ T cells. Symbols represent individual mice or patients, and lines represent median. Mann–Whitney test was used for statistical analysis **p < 0.01
