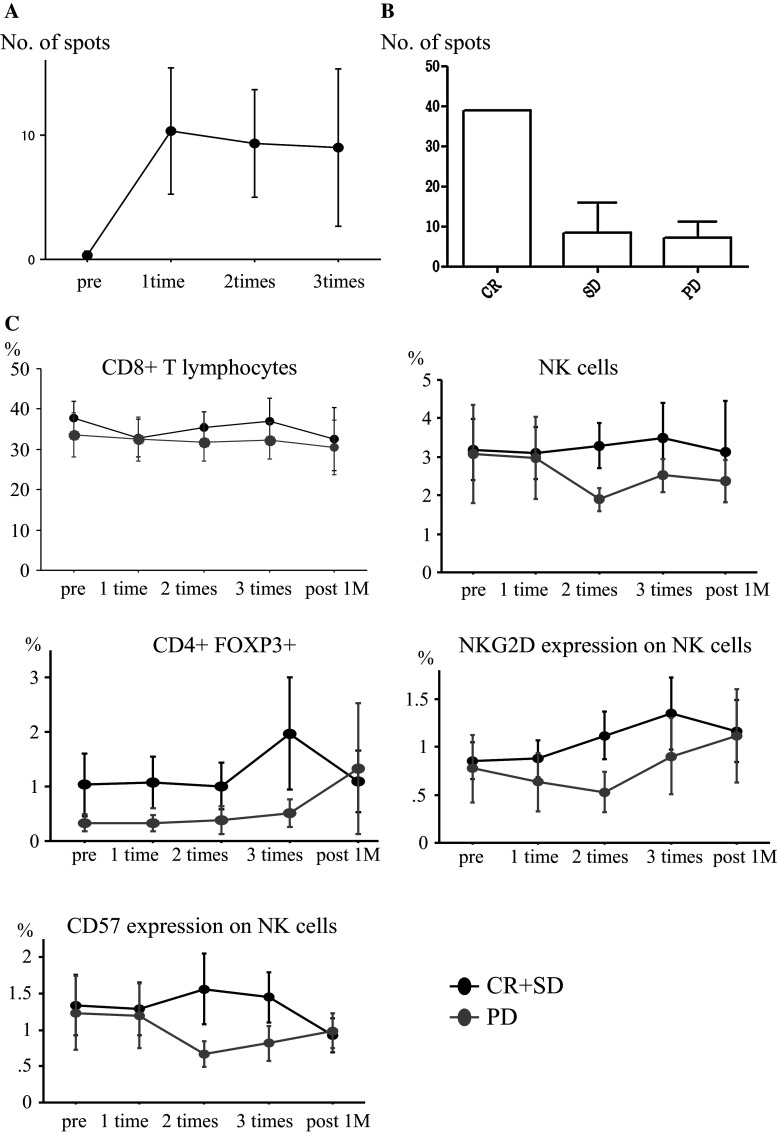
Fig. 2.
a Enzyme-linked immunospot analysis. The number of spots is shown. Time points tested were prior to treatment, after the first treatment, after the second treatment, and 1 month after the third treatment. Data are mean ± standard error. b Number of spots in ELISPOT assays at two time points. CR had 39 spots, SD had 8.4 (±7.4, SE), and PD had 7.2(±3.9, SE). c Population kinetics of immune effector cells in patients. Patients with CR and SD tended to have a higher percentage of CD4+/FoxP3+ T cells. In patients with CR and SD, the percentage of CD3−/CD56+ cells, which are supposed to be NK cells, were higher than in PD. For NKG2D-expressing NK cells, the percentages in the patients of CR and SD increased, but not in PD. CD57+ NK cells from the group of CR and SD had the same trend, indicating that activated NK cells were induced by treatment. However, these trends were not statistically significant

