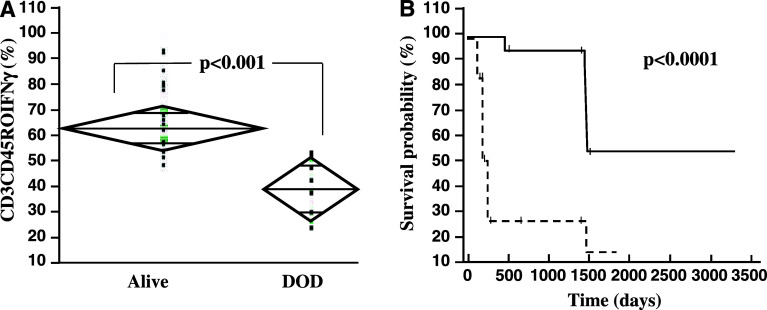
Fig. 2.
IFNγ expression and survival. a Data are given as boxplots of percentage of IFNγ+ cells in the CD45RO+CD3+-fraction on day +200. Survivors showed higher percentages of IFNγ producing memory T-cells. DOD death of disease. b Kaplan–Maier analysis for patients with higher vs. lower production of IFNγ in T-cells. At day + 60 post-transplantation, PBMC of patients (n = 17) were stimulated and determination of IFNγ-positive cells was done by FACS analysis. Results were defined as IFNγ high producers (9/17) if more than 40% of T-cells showed IFNγ expression and as low producers (8/17) if less than 40% of T-cells were IFNγ positive. 1,500 days post-transplantation survival was 55% in IFNγ high producers vs. 15% in IFNγ low producers (P < 0.0001)

