Fig. 3.
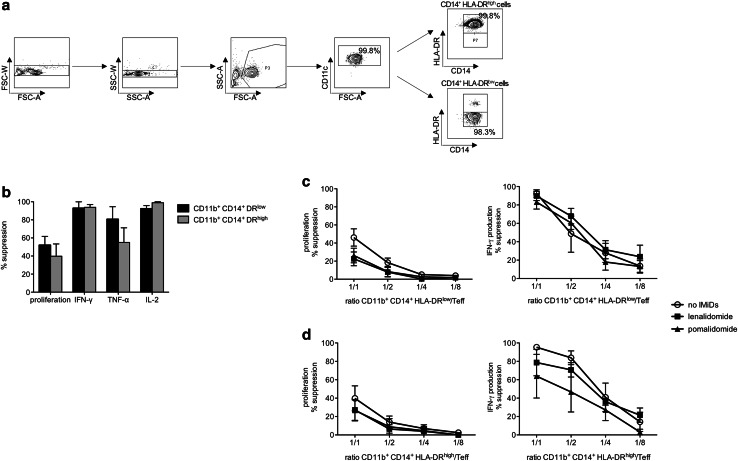
Effects of IMiDs on the suppressive effects of MDSCs on Teffs. a MDSCs were purified by FACS based on a CD11b+ CD14+ HLA-DRlow/− phenotype. The expression of CD14 and HLA-DR on either purified CD11b+ CD14+ HLA-DRhigh or purified CD11b+ CD14+ HLA-DRlow/− cells is shown on the flow cytometry plots. One representative out of five experiments is shown. b Overview graph showing the suppression of CD8+ T-cell proliferation and cytokine production by either autologous CD11b+ CD14+ HLA-DRlow/− or autologous CD11b+ CD14+ HLA-DRhigh cells upon a myeloid cell/T cell co-culture performed at a 1/1 ratio. The bars indicate the mean of four independent experiments, and the error bars indicate the SEM. c, d Purified CD8+ T cells from MM patients (‘Teffs’) were stimulated with anti-CD3 and anti-CD28-coated microbeads and co-cultured with FACS purified CD11b+ CD14+ HLA-DRlow/− or CD11b+ CD14+ HLA-DRhigh cells at different ratio’s. After 6 days of co-culture, the CD8+ T-cell proliferation was determined by flow cytometry and the cytokine concentration in the culture supernatants was determined by ELISA. The percentage suppression of CD8+ T-cell proliferation and cytokine production was calculated as 100 % − (T-cell response in condition with myeloid cells/T-cell response in condition without myeloid cells) * 100 %. Each symbol represents the mean of 4 (HLA-DRhigh cells) or 5 (HLA-DRlow/− cells) experiments, and the error bar represents the SEM

