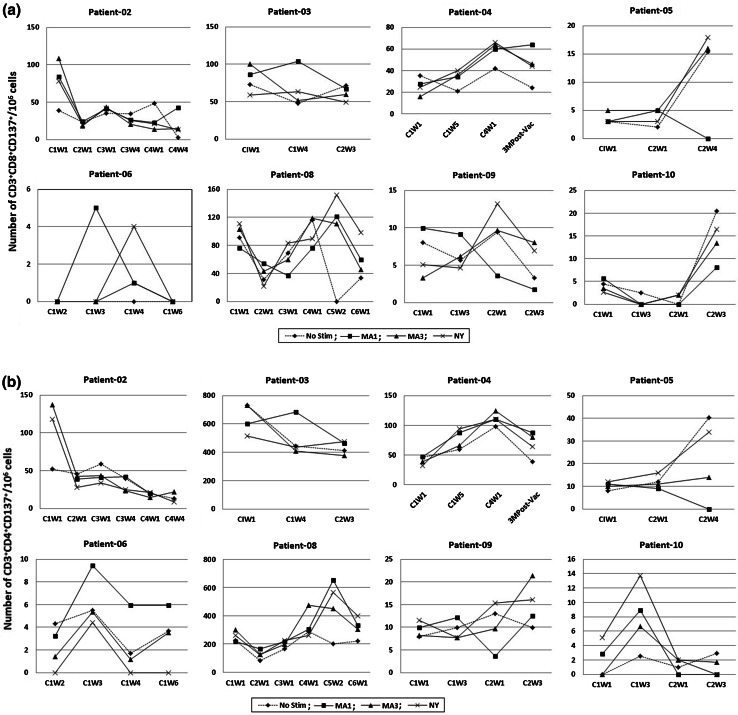
Fig. 2.
Antigen-specific T cell responses to the vaccine. Peripheral blood mononuclear cells were archived at various time points (as indicated on x-axis), stimulated for 24 h with MAGE-A1, MAGE-A3 and NY-ESO-1 peptide mixes and analyzed for the presence of CD137+ antigen-specific CD8+ (a) and CD4+ (b) T cells by flow cytometry. C1W1 indicates Cycle1-week1 of therapy. a CD8 T cell response, b CD4 T cell response

