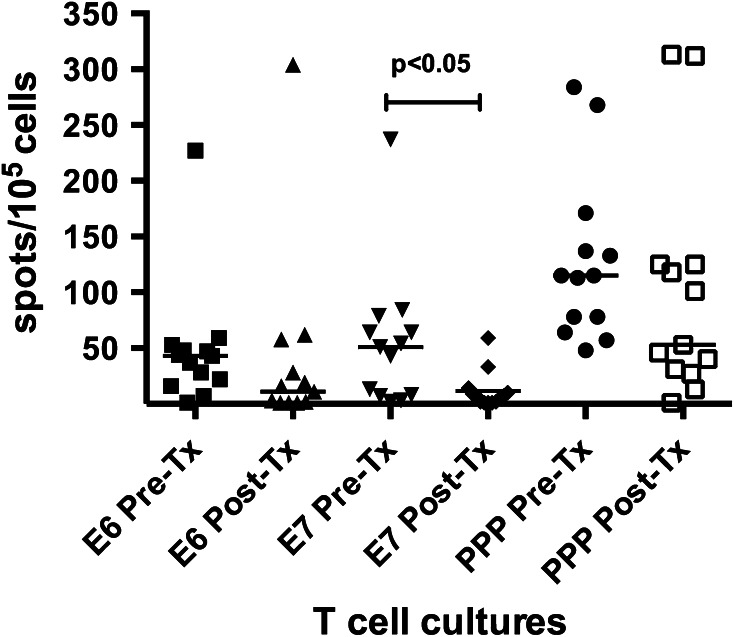
Fig. 1.
Scatter plot of all evaluable patients tested for HPV16 E6 and E7, and PPP-peptide-specific T cell responses by IFN-γ ELISPOT. Each dot represents a mean spot count for the replicate test wells (T cells + PBMC + peptide) after subtraction of the background (T cells + PBMC). The horizontal bars indicate the means for all patients (n = 13)

