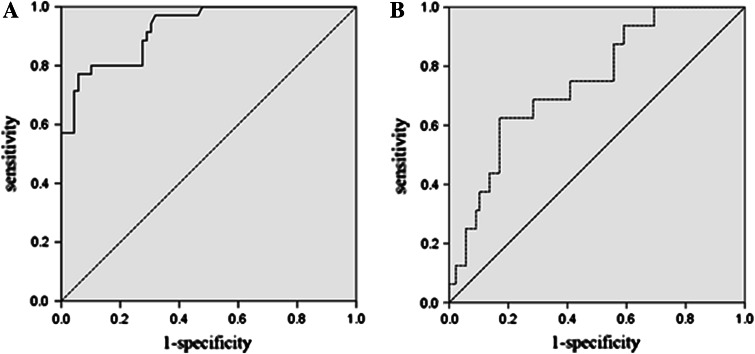
Fig. 3.
a ROC curve analysis of the different MLAA-34 levels with expression-positive patients and expression-negative patients. The area under the curve was 0.925. The best cutoff point was at approximately 1.63E+01. b ROC curve analysis of the different MLAA-34 protein ratios with expression-positive patients and expression-negative patients. The area under the curve was 0.738. The best cutoff point was at about 35%

