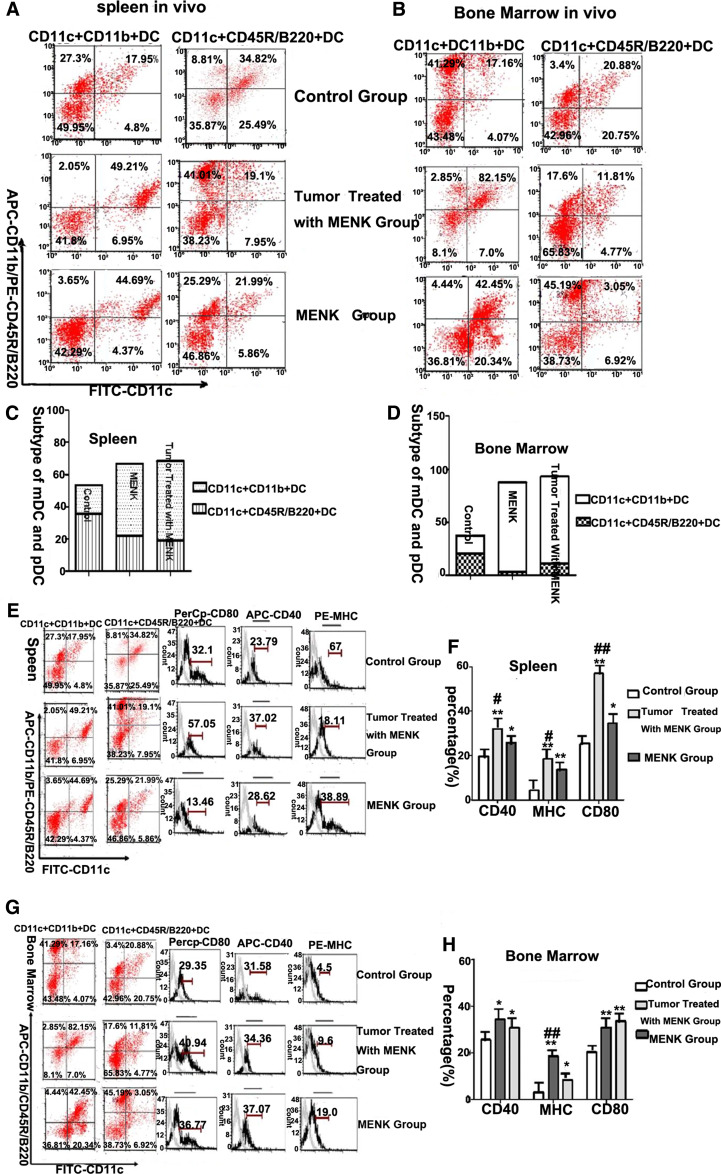
Fig. 4.
The induction effect of MENK for the differentiation of DCs in vivo. a–d The subtypes distribution of myeloid DC (mDC, CD11c+CD11b+ DC) and plasmacytoid DC (pDC, CD11c+CD45R/B220+ DC) in tumor-bearing mice and normal mice by FCM. a The results of immunophenotypes of DCs in spleen. Similar results were obtained from four separate experiments. b The results of immunophenotypes of DCs in bone marrow. Similar results were obtained from four separate experiments. c, d The analysis of histogram with the subtypes of mDC and pDC in spleen and bone marrow. e, f The expressions of costimulatory molecules on the DCs in spleen in the C57BL/6 normal control group, tumor treated with MENK group and MENK group. e Dotplot analysis by FCM. f The statistical analysis of histogram by GraphPad prism5. **p < 0.01 versus in the C57BL/6 normal control group, *p < 0.05 versus in the C57BL/6 normal control group, ## p < 0.01 versus in the tumor treated with MENK group, # p < 0.05 versus in the tumor treated with MENK group. g, h The expressions of costimulatory molecules on the DCs in bone marrow in the C57BL/6 normal control group, tumor treated with MENK group and MENK group. g Dotplot analysis by flow cytometry. h The statistical analysis of histogram by GraphPad prism5. *p < 0.05 versus in the C57BL/6 normal control group; # p < 0.05 versus in the tumor treated with MENK group. **p < 0.01 versus in the C57BL/6 normal control group; ## p < 0.01 versus in the tumor treated with MENK group

