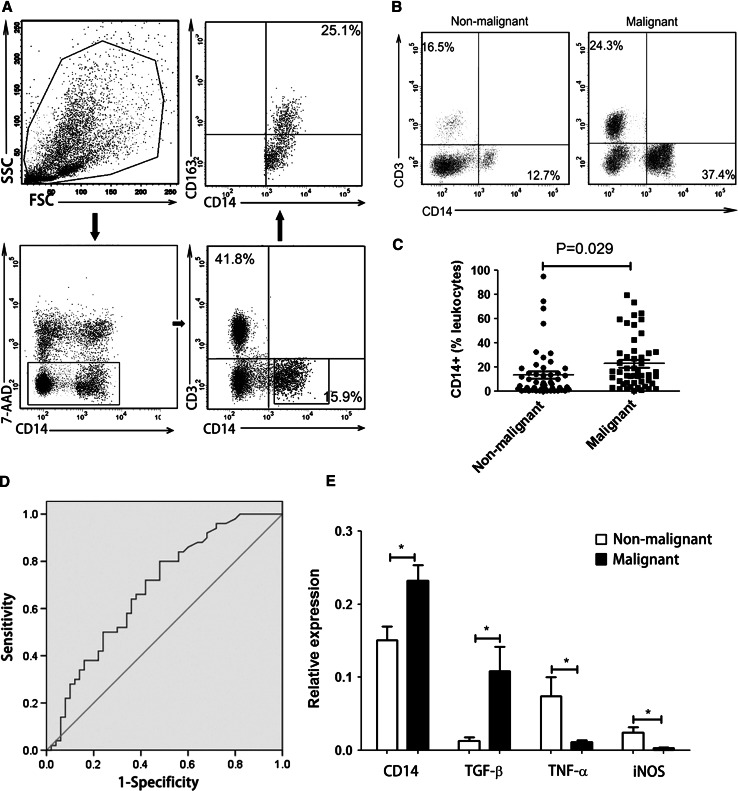
Fig. 1.
Characterization of CD14+ monocytes derived from MPE and NMPE. a Representative phenotypic analysis of 7-AAD−CD3−CD14+CD163+ cells in pleural effusion by using flow cytometry. b Comparison of CD14+CD3− monocyte frequency in MPE and NMPE by using flow cytometry. One representative analysis from MPE and NMPE cases is shown. c Comparison of CD14+ monocyte frequency in MPE and NMPE. Results presented as a scatter diagram. d ROC analysis of CD14+ cell frequency in MPE with AUC of 0.685. e RT-PCR was performed to assess the relative expression of TGF-β, TNF-α, and iNOS in purified CD14+ cells derived from MPE versus NMPE, normalized by . Results presented as histogram. *P < 0.05

