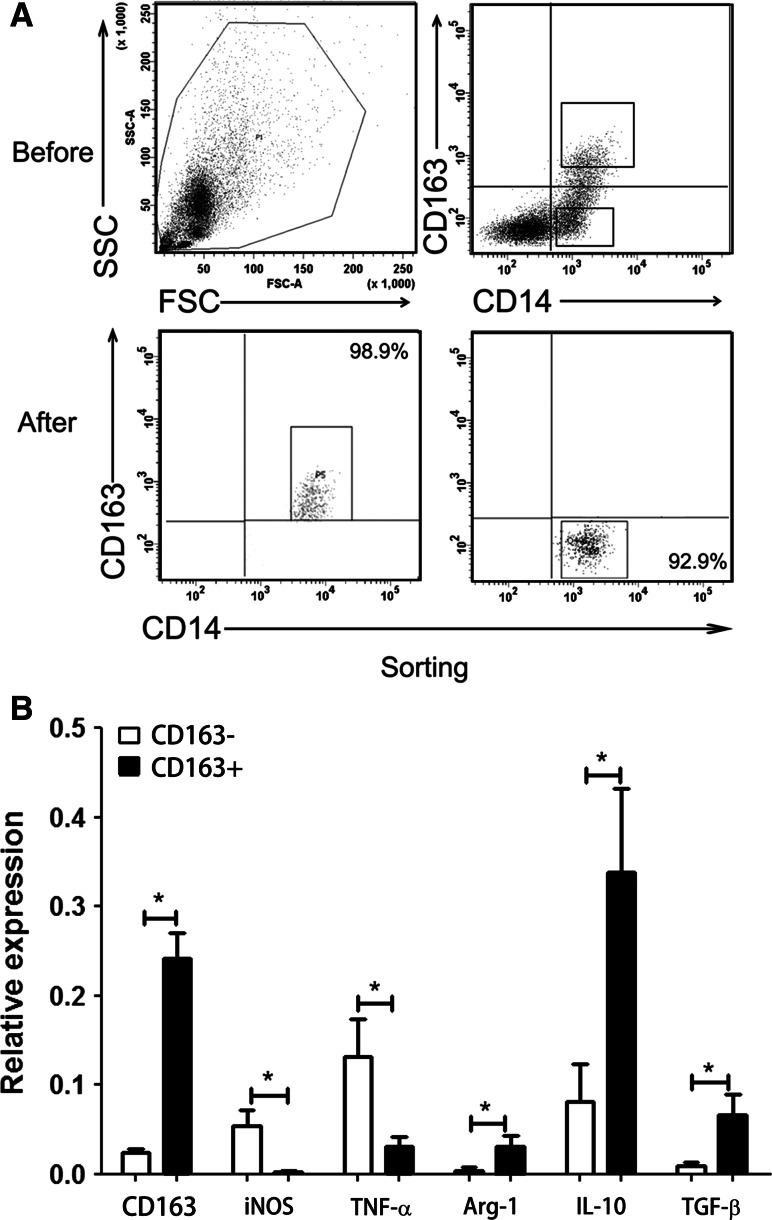
Fig. 2.
Expression of inflammatory cytokines in CD163+CD14+ and CD163−CD14+ cells. a CD163+CD14+ and CD163−CD14+ cells were purified from MPE using FACS. One representative analysis is shown. b Relative expression of iNOS, TNF-α, arginase-1, IL-10, and TGF-β in CD163+CD14+ cells and CD163−CD14+ cells derived from MPE, normalized by . Results presented as histogram. *P < 0.05

