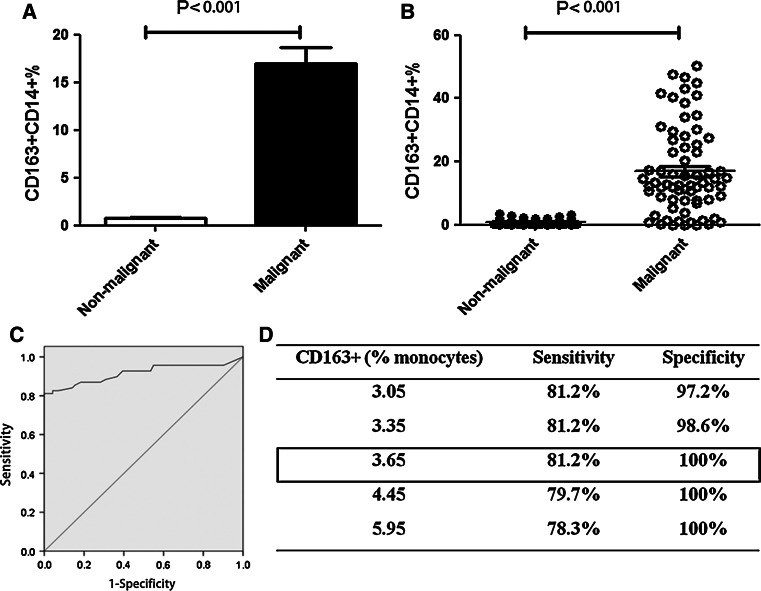
Fig. 5.
CD163+CD14+ cell frequency in MPE and NMPE from total 140 cases. Histogram (a) and scatter diagram (b) of CD163+CD14+ cell frequency in MPE (n = 69) and NMPE (n = 71). c ROC analysis was performed with an AUC of 0.916 (P < 0.001). d Using a cutoff level of 3.65 %, the percentage of CD163+CD14+ cells was used to predict MPE prevalence, and the assay had a sensitivity of 81.2 % and a specificity of 100 %

