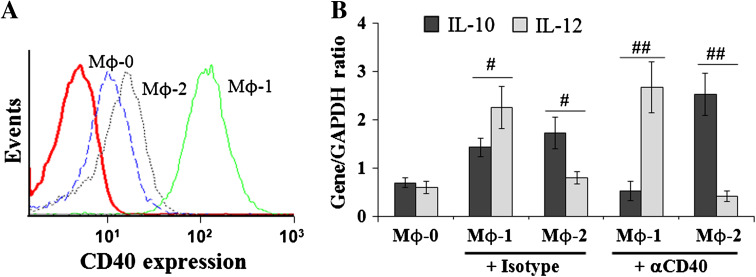
Fig. 1.
Functional features of polarized Mϕs. a Flow cytometry analysis. CD40 expression is higher in Mϕ-1 than in Mϕ-2 and in control cells. b RT-PCR analysis. CD40 activation leads to the generation of Mϕ-1 with negative-IL-10 and high-IL-12 expression profile and Mϕ-2 with high-IL-10 and negative-IL-12 expression profile. The relative mRNA expression of gene of interest was expressed as gene/GAPDH ratio; # p < 0.05 and ## p < 0.01 denote significant difference between groups

