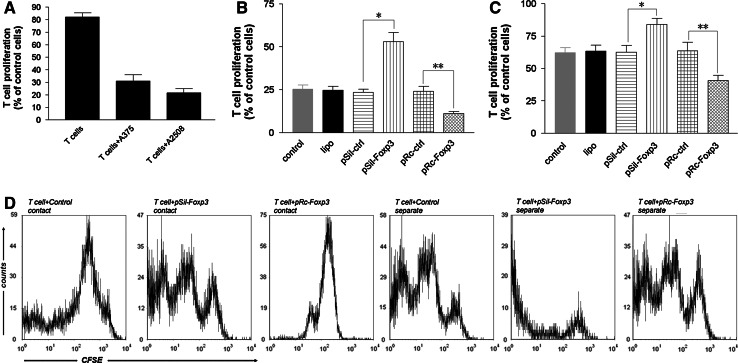
Fig. 5.
a Proliferation of CD4+CD25− T cells after stimulation and coculture with melanoma for 3 days cells was measured using CFSE staining. The number of proliferating T cells was normalized to the number of activated T cells. b A2058 cells were transfected with lipo, pSil-ctrl, pSil-Foxp3, pRc-ctrl, or pRc-Foxp3 and cocultured with activated CD4+CD25− T cells. Columns, mean values of 3 independent experiments; bars, standard deviation. Statistical significance was confirmed using the two-paired t-test. *P < 0.001; **P < 0.05. There was no difference between the levels of the control and those of lipo, pSil-ctrl, or pRc-ctrl, suggesting that the suppressive activity was not because of any nonspecific effect. c Results similar to those in b were found even when the A2058 cells and T cells were separated using Transwell inserts. *P < 0.05; **P < 0.05. There was no difference between the levels of the control and those of lipo, pSil-ctrl, or pRc-ctrl. d Representative flow cytometry histograms of the CFSE-labeled T-cell proliferation cocultured with A2058 cells (control, transfected with pSil-Foxp3 or pRc-Foxp3)

