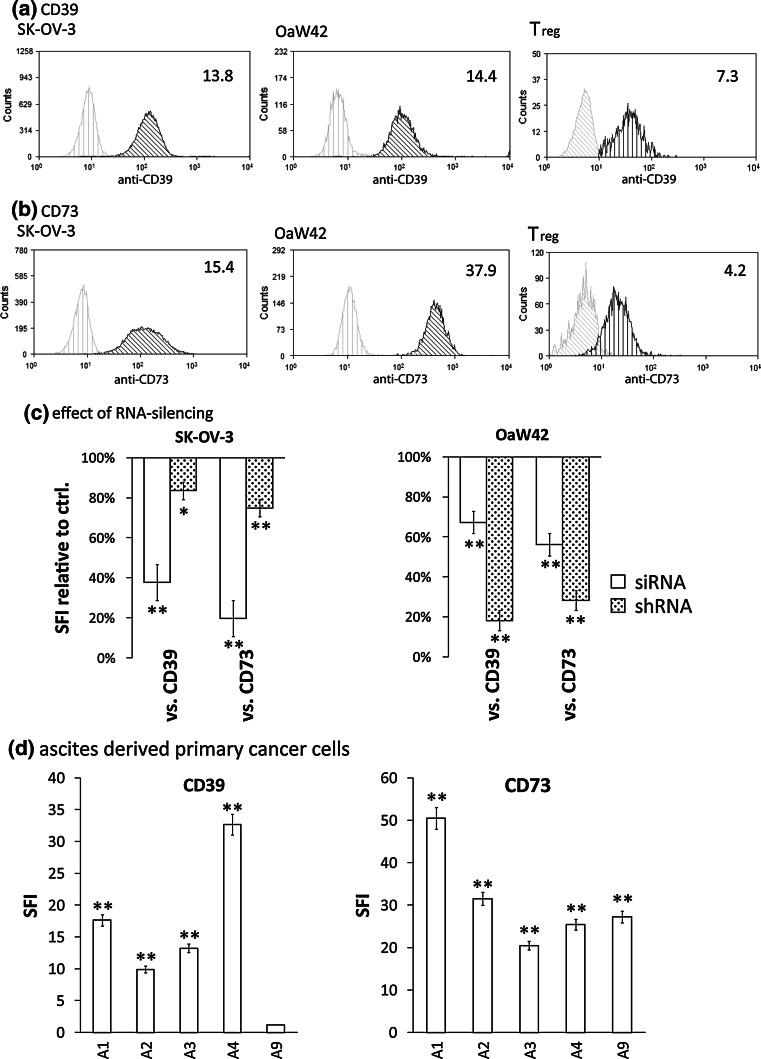
Fig. 2.
Analysis of CD39 and CD73 surface levels on primary OvCA cells, OvCA cell lines and Treg. (a, b) SK-OV-3, OAW42 OvCA and freshly isolated human regulatory T cells (Treg) cells were stained for expression of CD39 (a) or CD73 (b) and analysed by flow cytometry. Representative histograms are shown. The indicated specific fluorescence indices (SFI values) were calculated by dividing the mean fluorescence obtained with the specific antibody (black profile) by the fluorescence intensity obtained with the corresponding) isotype control (grey curve) (n = 3). c SK-OV-3 and OAW42 OvCA were transfected with either siRNAs against CD39 or CD73 (siCD39, siCD73, open bars) or with pSUPERpuro plasmids encoding short hairpin RNAs which target the same sequence (shaded bars). CD39 and CD73 surface expression were assessed either 3 days after transient transfection with siRNA or after selection of stable clones expressing pSUPERpuroCD39 (shCD39) or pSUPERpuroCD73 (shCD73), respectively. FACS analysis and evaluation were performed as in (a). d Magnetic beads were used to purify EpCAM-positive OvCa cells from ascites (n = 15). SFI values for CD39 and CD73 expression were determined as described above and are shown for five representative primary tumour cell cultures

