Fig. 1.

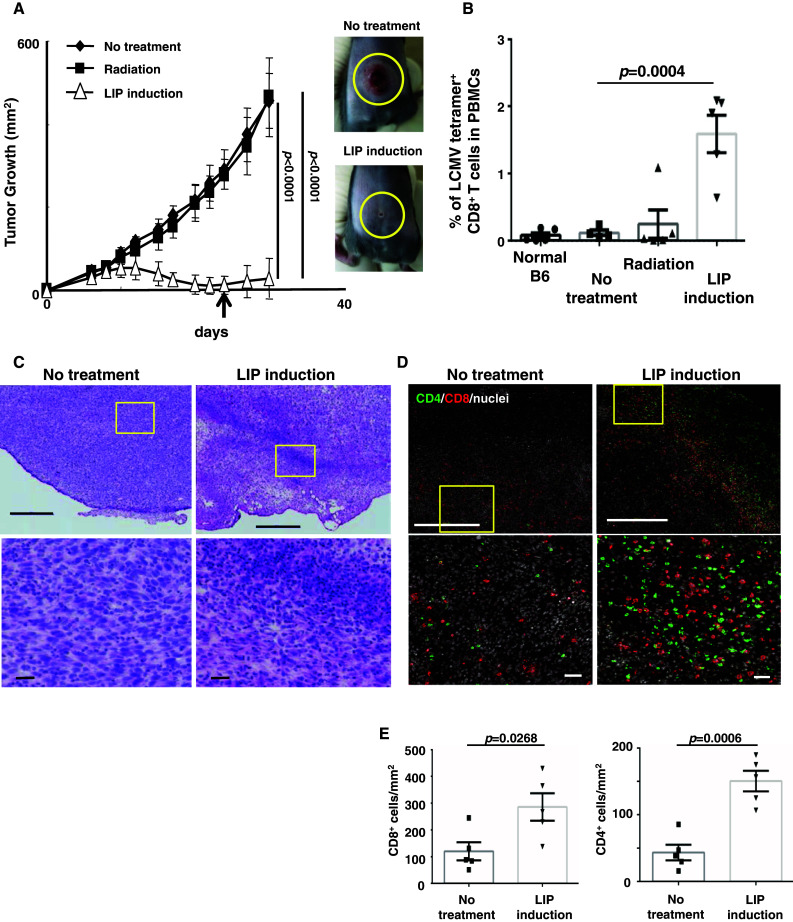
During LIP, CTL precursors preferentially expand and migrate into tumor tissues, resulting in tumor regression. a Tumor growth was significantly suppressed by LIP. To eliminate host lymphocytes, on day 0, mice were sub-lethally irradiated and then injected with 1 × 10⁶ LLC-gp33 cells (black squares). Some mice were also injected with 2 × 10⁷ splenocytes (white triangles). Black diamonds indicate the no-treatment group. Bars SD based on the results of 3 mice from 4 repeated experiments. Photographs show the tumor mass at 30 days in no-treatment (upper panel) or LIP-induced hosts (lower panel). b CTL precursors expanded in lymphopenic hosts. The percentage of LCMV tetramer+ CD8+ T cells in PBMCs were monitored by FACS, 24 days after LIP induction (a an arrow). Bars in a, b SE based on the results of 5 mice from 2 independent experiments. The p values in the graphs indicate the statistical significance of the difference between the no-treatment group and the LIP induction group. c, d Tumor tissues were harvested from no-treatment or LIP-induced hosts 15 days after LIP induction. Frozen sections of tumor tissues were fixed and analyzed by H&E (c) and IHC staining (d). The images show the representative data of tumor tissue in 5 mice from 2 independent experiments. Lower photographs show an enlarged view of the yellow square in upper photographs. Scale bar upper figures, 500 μm; lower figures, 50 μm. e The graphs indicate the numbers of tumor-infiltrating CD8+ (left graph) and CD4+ (right graph) cells per mm2 in tumor tissues shown in Fig. 1d. The p values in the graph indicate the level of statistical significance between the no-treatment and LIP induction groups. Bars SE based on results of 5 mice from 2 independent experiments
