
Fig. 4.
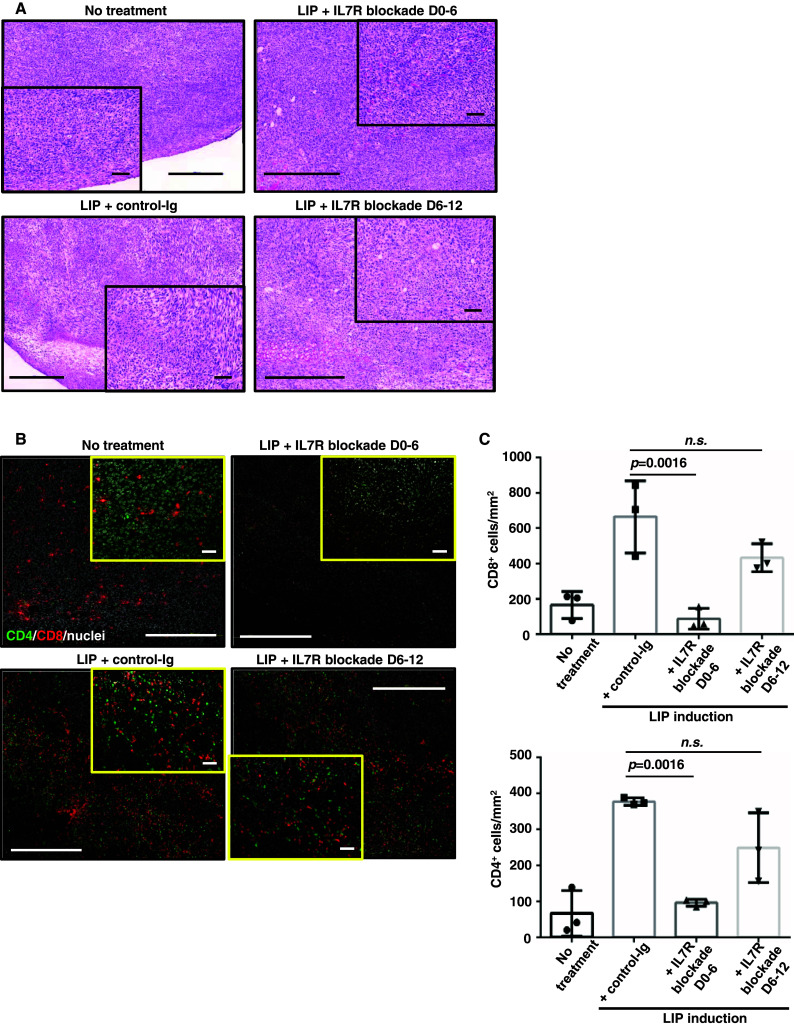
The number of TILs decreases when IL7 signaling is blocked. Tumor tissue recovered from mice 14–16 days post-inoculation, for no-treatment, LIP induction with control-Ig, LIP induction with IL7R blockade D0–6, and LIP induction with IL7R blockade D6–12. Tissue sections were treated as described in Fig. 1. The images show representative tumor tissue from 3 independent experiments with n = 3. Inset photographs show high-magnification views of main photographs. Scale bar main figures, 500 μm; insets, 50 μm. a H&E staining of tumor tissues. b IHC staining of CD4+ and CD8+ cells. c The graphs indicate the numbers of tumor-infiltrating CD8+ (upper graph) and CD4+ (lower graph) cells per mm2 in tumor tissue. The p values in each graph indicate statistical significance of the difference between control-Ig and each group with an IL7R blockade in the LIP-induced hosts. Bars SD based on the results of 3 mice in one of 3 independent experiments