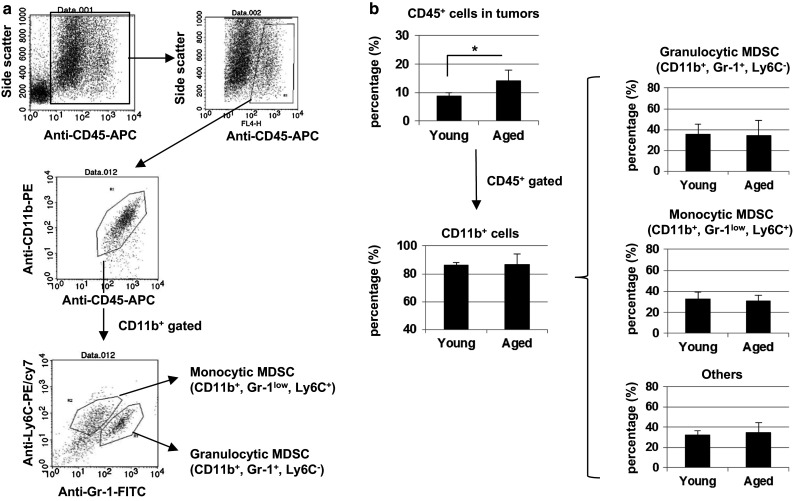
Fig. 4.

Infiltration of CD45+ immune cells into the tumor sites. Young (7 W) and aged (60 W) BALB/c mice were injected s.c. into four sites with 1 × 10⁶ CT26 cells. On day 5, the tumors were harvested from each mouse separately and analyzed by flow cytometry. a The staining and gating strategies are shown. b The percentages of tumor-infiltrating CD45+ immune cells, CD11b+ cells among CD45+ cells, and myeloid-derived cells among CD11b+ cells are shown. The mean ± SD of four mice is shown *P < 0.05
