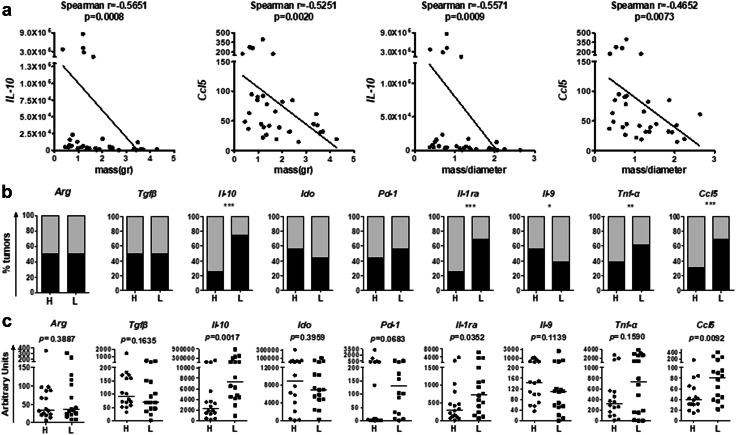
Fig. 3.
Correlations of gene expression and growth characteristics. a Grouped analyses of gene expression, in relation to mass and mass/diameter ratio. All tumors generated by all clones/lines (n = 32) were included. Il-10 and Ccl5 mRNA levels negatively correlated to mass and mass/diameter ratio. b Graphs display percentages of tumors exhibiting more or less aggressive phenotype (i.e., high (H) mass vs low (L) mass and high mass/diameter vs low ratio). Tumors with H or L mass were the same with those exhibiting H or L mass/diameter ratio. c Scatter dot plots present individual tumors exhibiting more (H) or less (L) aggressive phenotype (H; n = 16, L; n = 16)

