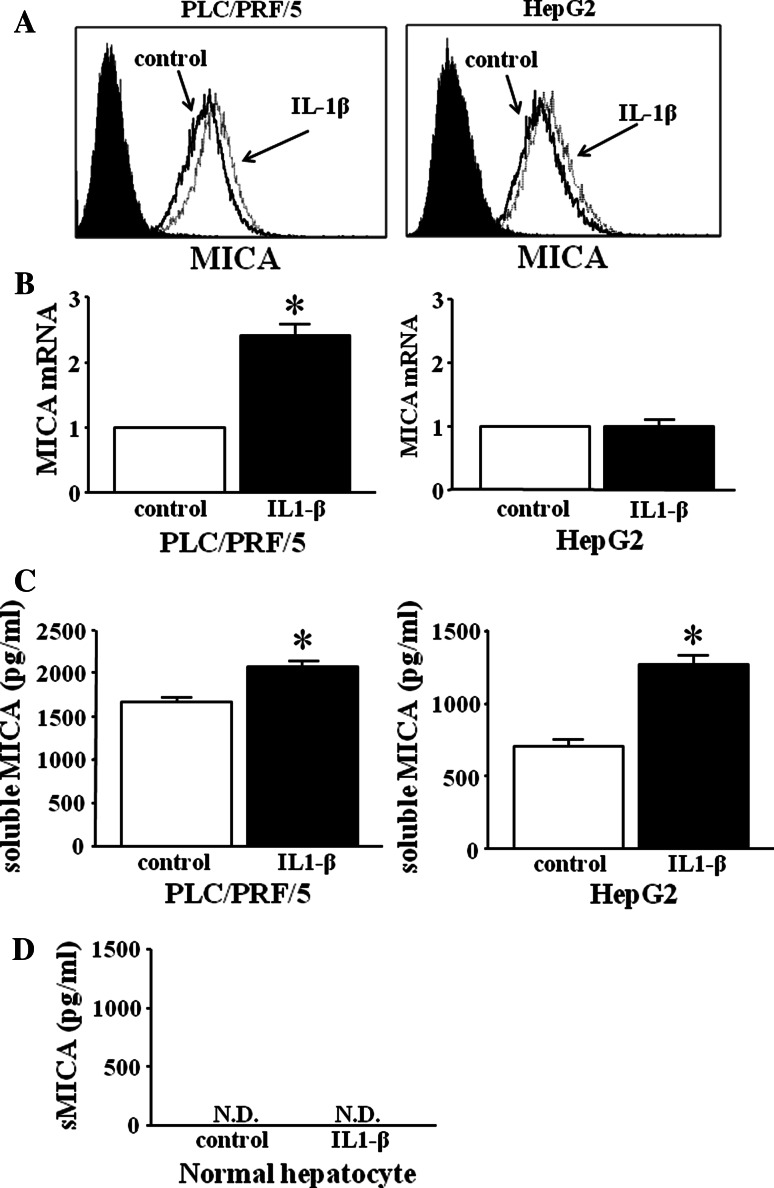
Fig. 2.
Expression of membrane-bound MICA and the production of soluble MICA in IL-1β-treated HCC cells and normal hepatocytes. Both PLC/PRF/5 cells and HepG2 cells were treated in the presence or absence of IL-1β (50 ng/ml) for 48 h. The expression of membrane-bound MICA (a) and mRNA expression of MICA (b) in IL-1β-treated or non-treated HCC cells were evaluated by flow cytometry or real-time RT-PCR, respectively. Black line histograms, MICA staining of non-treated cells; dotted line histograms, MICA staining of IL-1β-treated cells; shaded/black histograms, control IgG isotype Ab staining. Similar results were obtained from two independent experiments. *p < 0.05. c We examined the production of soluble MICA on IL-1β-treated or non-treated HCC cells by specific ELISA. *p < 0.05. d Normal hepatocytes were treated in the presence or absence of IL-1β (50 ng/ml) for 48 h. The production of soluble MICA on IL-1β-treated or non-treated normal hepatocytes was examined by specific ELISA. ND not detected

