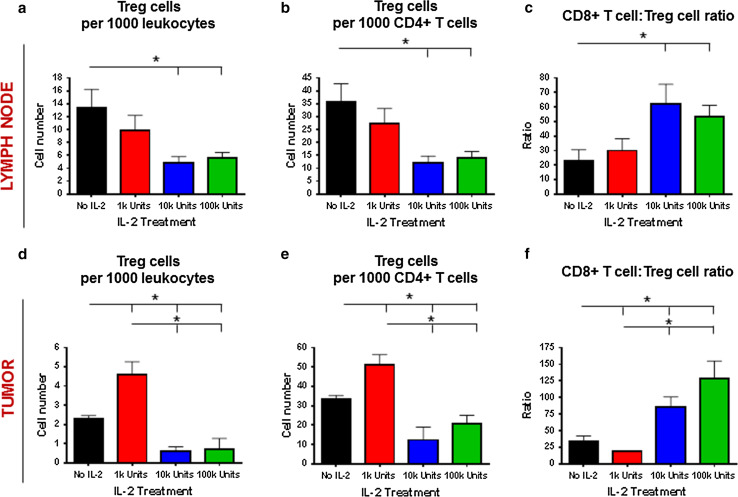
Fig. 4.
Correlation of Tregs with IL-2 treatment dose outcomes. Number of Tregs per a 1000 leukocytes and b 1000 CD4+ T cells, as well as the c CD8+ T cell-to-CD4+ Treg cell ratio obtained from tumor-draining lymph nodes of mice (n = 4 per group) from Fig. 2 on day 14. Number of Tregs per d 1000 leukocytes and e 1000 CD4+ T cells, as well as the f CD8+ T cell-to-CD4+ Treg cell ratio obtained from tumor-draining lymph nodes of mice (n = 4 per group) from Fig. 2 on day 14. *Comparisons for which P < 0.05. Results are representative of two experiments with similar results

