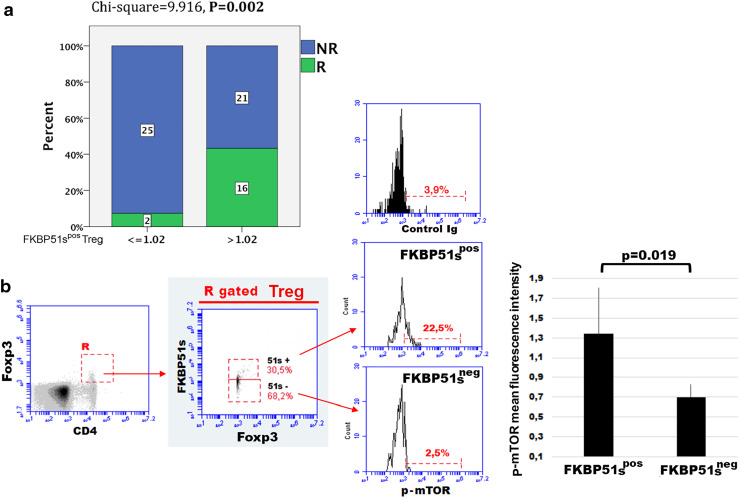
Fig. 3.
FKBP51s expression in Tregs can predict immunotherapy response and is associated with high p-mTOR levels. a Distribution of R and NR according to FKBP51s Treg count and multivariate analysis. b p-mTOR expression in Tregs. Once placed a gate on the Foxp3/CD4 double positive cell, FKBP51spos and FKBP51sneg Treg subsets were selected as shown in the middle histogram. Then, p-mTOR levels were measured in gated Treg subsets (see “Materials and methods” for details)

