Fig. 3.
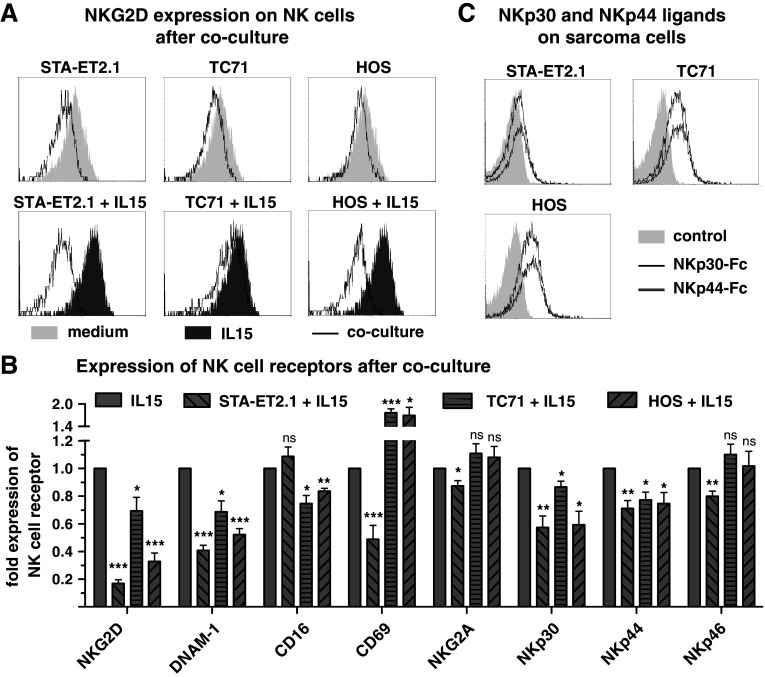
NKp30 and NKp44 down-regulation on NK cells is not associated with NKp30 and NKp44 ligands expression on sarcoma cells. a Representative FACS overlay plots of the geometric mean fluorescent intensity of NKG2D expression on NK cells after 40 h incubation of TCD PBMC with medium (light gray area) and with IL15 (dark gray area) and after 40 h coculture (black solid line) with the sarcoma cell lines STA-ET2.1 (left panel), TC71 (middle panel) and HOS (right panel) in the presence or absence of IL15. b Expression of the NK cell receptors NKG2D, DNAM–1, FcγRIIIa/CD16, NKG2A, NKp30, NKp44 and NKp46 and of the NK cell activation marker CD69 was investigated after the coculture of TCD PBMC with STA-ET2.1, TC71 or HOS cells in the presence of IL15. Fold expression data were calculated from geometric mean fluorescence intensities and combined from multiple experiments. c FACS overlay plots, detecting NKp30 ligands by NKp30-Fc fusion protein (black solid line), NKp44 ligand by NKp44-Fc fusion protein (gray solid line) and isotype-matched negative control by the anti-CD20 mAb rituximab (light gray area), all followed by secondary antibody, on STA-ET2.1, TC71 and HOS cells

