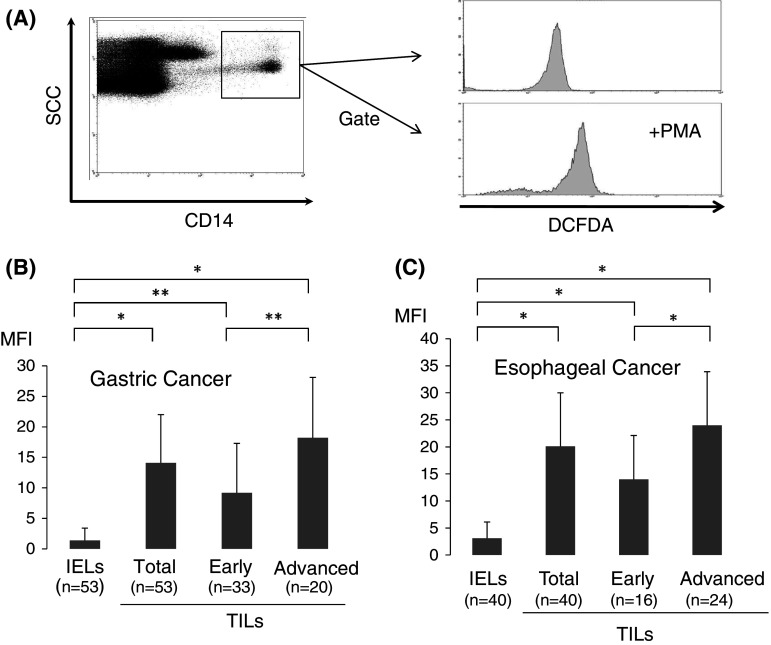
Fig. 2.
H2O2 production within tumor microenvironments. The production of H2O2 derived from tumor-infiltrating Mϕ was quantitatively evaluated with flow cytometric analysis employing the DCFDA/PE-CD14 technique (a). H2O2 production, defined as the mean fluorescence intensity (MFI), is shown in TILs and IELs of gastric (b) and esophageal cancer (c). The definition of early and advanced disease of gastric and esophageal cancer is described in the legend of Fig. 1. Data were analyzed using a non-paired Student’s t-test, and findings were considered significant when p values were <0.01 (*). or < 0.05 (**)

