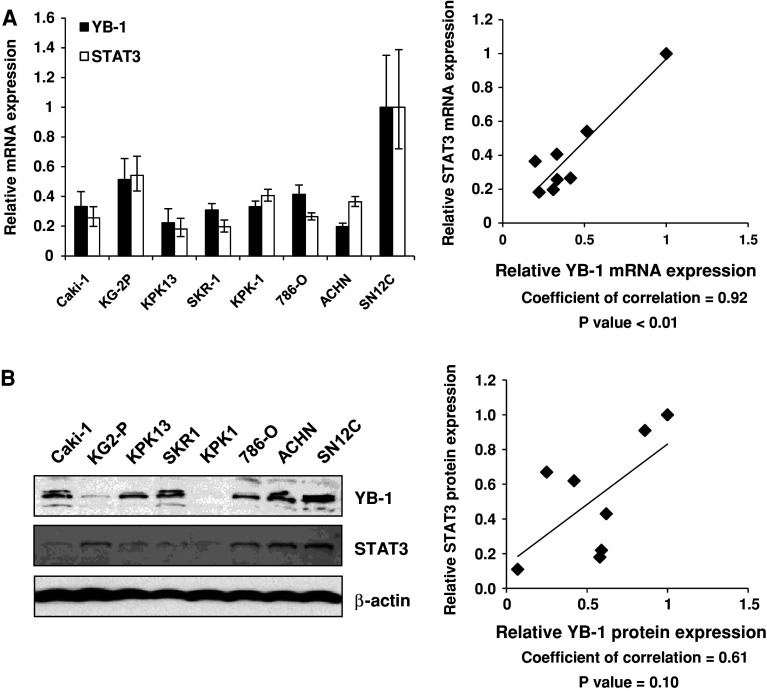
Fig. 2.
YB-1 expression level correlates with STAT3 expression in renal cancer cells. a Total RNA was extracted from the indicated 8 renal cancer cell lines. Following extraction of total RNA and synthesis of cDNA, quantitative real-time PCR was performed using the primers and probes for YB-1, STAT3, and GAPDH. YB-1 and STAT3 transcript levels were corrected for the corresponding GAPDH transcript levels, respectively. All values represent at least three independent experiments. Correlation between YB-1 and STAT3 transcript levels was analyzed. The transcript levels of YB-1 and STAT3 in SN12C cells were set to 1. b Whole-cell lysates were extracted from the indicated 8 renal cancer cell lines and subjected to SDS–PAGE. Western blotting was performed using the indicated antibodies. Correlations between YB-1 and STAT3 protein level were analyzed. The protein levels of YB-1 and STAT3 in SN12C cells were set to 1

