Fig. 1.
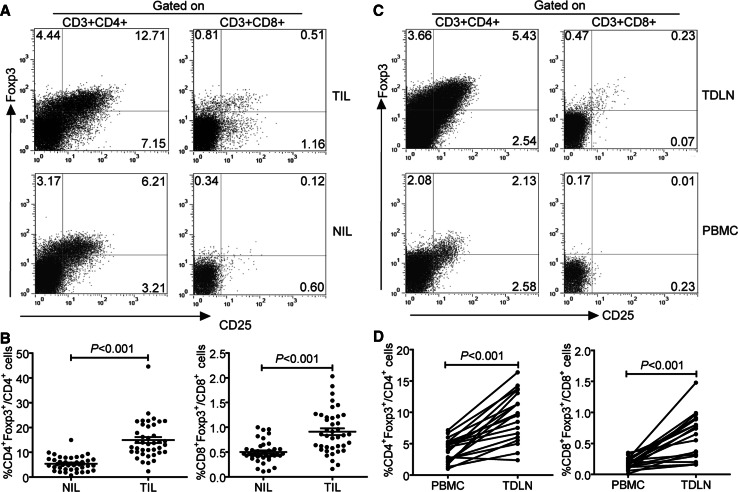
Distribution of CD3+CD8+Foxp3+ T lymphocytes in TIL, NIL, TDLN, and PBMC of patients with GC. a A representative flow cytometry analysis of lymphocytes in TIL and NIL of the same patients for Foxp3 versus CD25 expression after gating on CD3+CD4+ or CD3+CD8+. b The frequencies of CD3+CD4+Foxp3+ and CD3+CD8+Foxp3+ T cells in TIL and NIL from 40 GC patients (horizontal bars, mean ± SEM; each circle, single donor). c The representative dot plot of CD25+Foxp3+ cells among CD3+CD4+ and CD3+CD8+ T cells in TDLN and PBMC of the same patient. d The frequency of CD3+CD8+Foxp3+ T cells in matched pairs of TDLN and PBL from 19 patients. Statistical analysis in b and d was shown by Student’s paired t test. Data were the mean ± SEM

