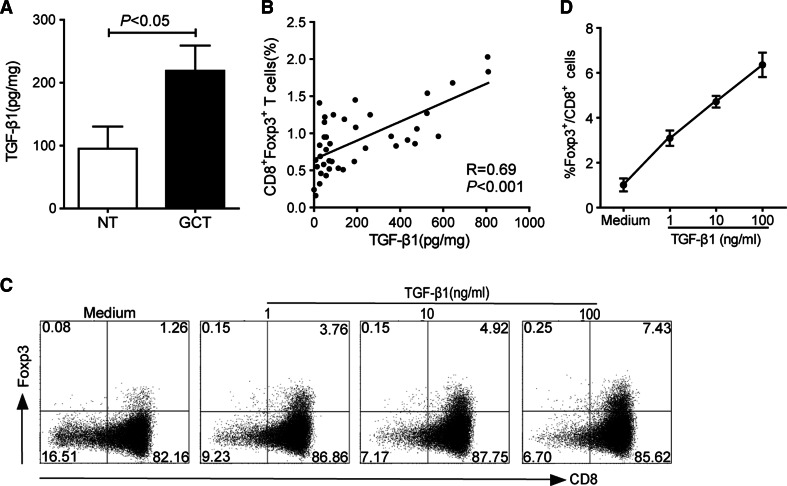
Fig. 3.
The differentiation of CD8+Foxp3+ T cells induced by TGF-β1. a TGF-β1 levels in tumor tissues (GCT, black bars) and non-tumor tissues (NT, white bars) of GC patients. Data were the mean ± SEM. b Correlation between the percentages of CD8+Foxp3+ T cells and the concentrations of TGF-β1 in tumor tissues of the patients. c Puried CD8+ T cells were cultured for 5 days with indicated different concentrations of rhTGF-β1 in the presence of rhIL-2, anti-CD3, and anti-CD28 antibodies. A representative dot plot is shown Foxp3 induction in CD8+ cells by flow cytometry. d The mean ± SEM of three independent experiments for the induction of CD8+Foxp3+ T cells

