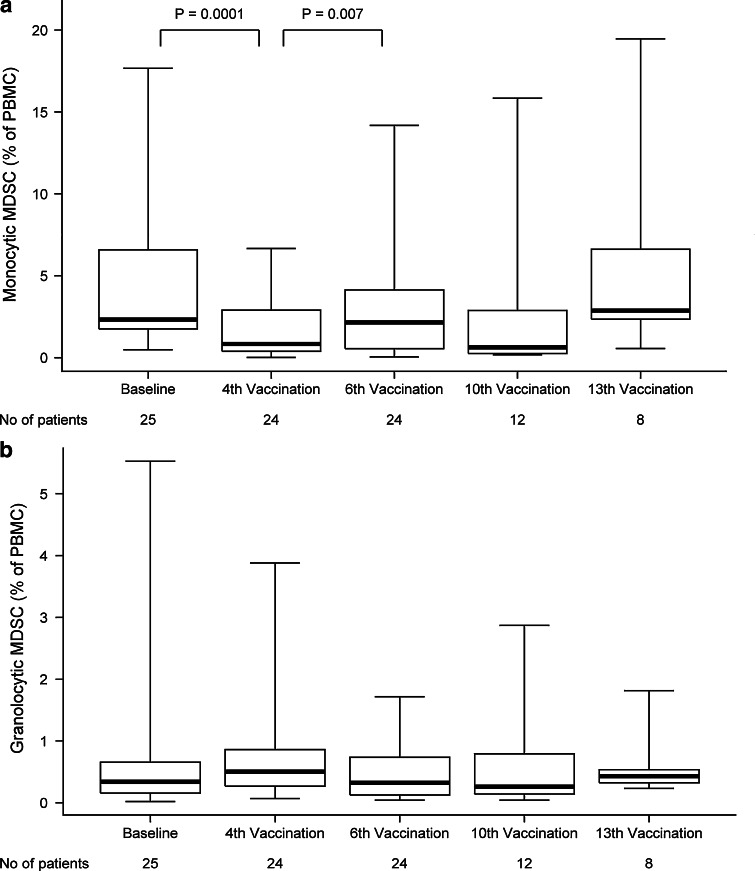
Fig. 5.
Myeloid-derived suppressor cells (MDSC). FACS analyses were used to depict the variation in MDSC. The average of a monocytic MDSC (HLA-DR−CD33+CD11b+CD15−CD14+) and b granulocytic MDSC (HLA-DR−CD33+CD11b+CD15+CD14−) and the variations during the vaccination course have been shown. For the last 2 time points, fewer patients are available to the analysis due to study drop out at the time of progressive disease (depicted as number (no) of patients beneath the figure)

