Fig. 2.
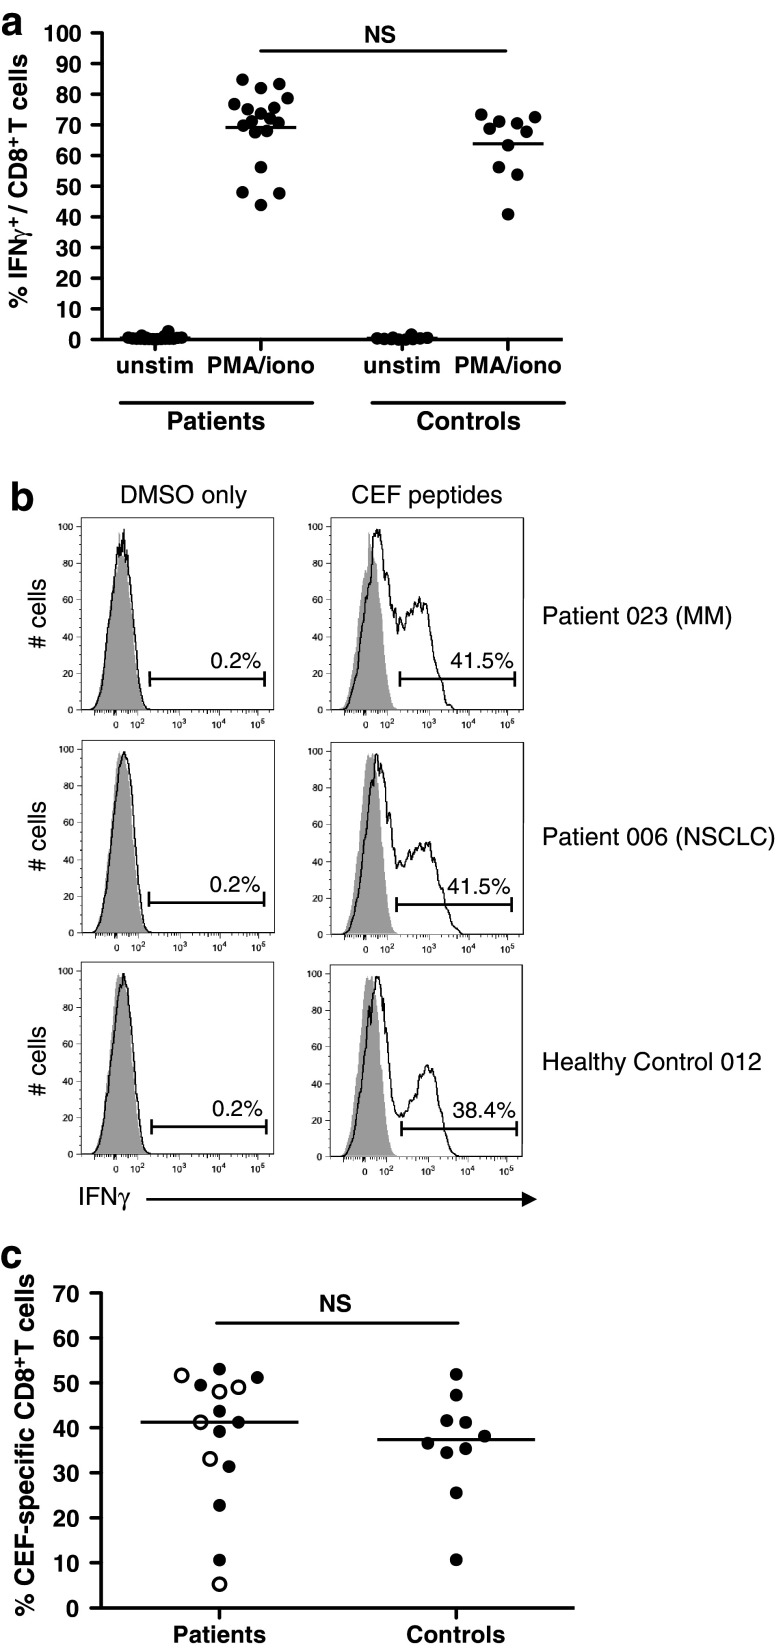
Assessment of cytokine production capacity and ability to respond to recall antigens. a PBMC from 18 patients (11 MM and 7 NSCLC) and 10 healthy controls were incubated for 5 h with PMA and ionomycin in the presence of BFA, or with BFA only (unstim), and then, IFNγ production assessed by flow cytometry. Dots represent individual patients/controls; line at mean. Groups were compared using the student’s t-test. NS, not significant. b and c Patient and healthy control PMBC were expanded and restimulated with CEF peptides (see Patients and Methods). Negative control samples (DMSO only) were expanded with the CEF peptides and then incubated with an equivalent volume of DMSO to that present in peptide-restimulated samples. b Representative plots gated on CD8+ T cells; shaded area corresponds to the isotype control. c Percentage of CEF-specific CD8+ T cells in patient versus healthy control samples; line at mean; groups compared using the student’s t-test. In the patient group, closed circles represent patients with MM and open circles represent patients with NSCLC. % CEF-specific cells = % IFNγ+ cells in CEF-restimulated sample—% IFNγ+ cells in DMSO only control

