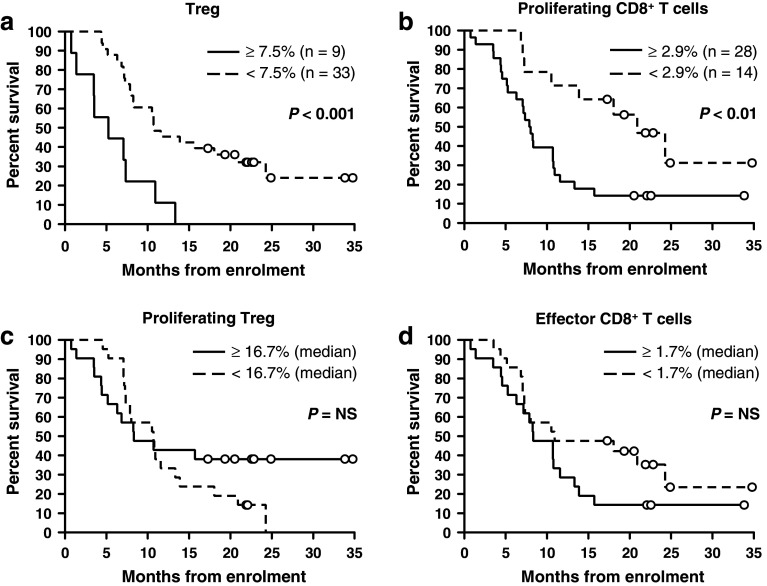
Fig. 3.
Kaplan–Meier plots of overall survival by proportion of Treg (a), proliferating (Ki67+) CD8+ T cells (b), proliferating Treg (c) and effector CD8+ T cells (d). Data were dichotomized at the point demonstrating the strongest association with survival in univariate regression analysis (a, b) or the median value if no statistically significant cut-off point could be found (c, d). For comparison, median and 95th percentile values for healthy controls were as follows: Treg 4.4, 7.3 %. Proliferating CD8+ T cells 2.6, 5.2 %. Proliferating Treg 18.5, 30.2 %. Effector CD8+ T cells 0.6, 1.4 %. Groups were compared using the logrank test. Circles represent censored observations

