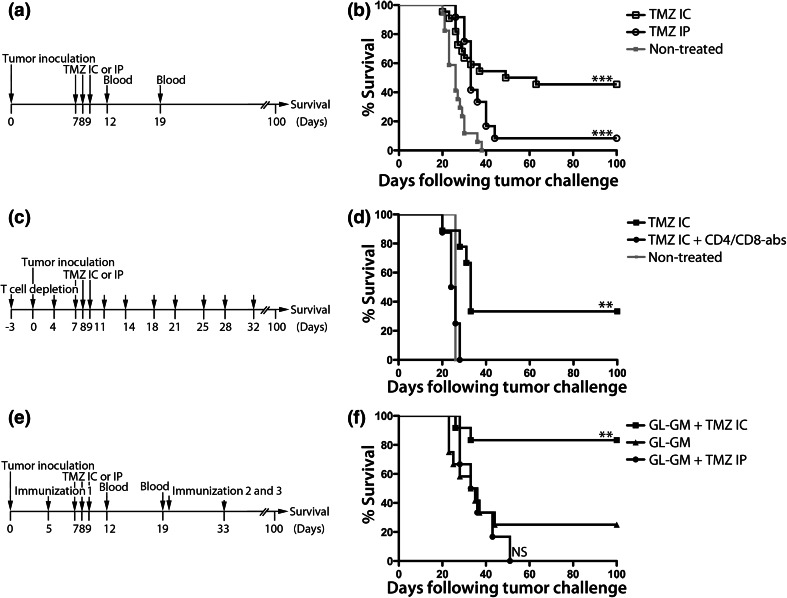
Fig. 2.
Survival following intratumoral versus systemic TMZ, following T cell depletion or combined with immunotherapy. Experimental setups and Kaplan–Meier survival curves of GL261-bearing mice receiving. a, b TMZ at day 7–9 administered either i.p. (TMZ IP, 50 mg/kg/day) or i.c. using a micro-osmotic pump/brain infusion kit (TMZ IC, 4.2 mg/kg/day) or no treatment (nontreated), n = 51. c, d TMZ IC alone or TMZ IC with injections of 100 + 100 μg CD4+ and CD8+ T cell depletion antibodies starting 3 days prior to tumor inoculation, twice a week for 5 weeks (TMZ IC + CD4/CD8-abs), n = 17. e, f TMZ IC or IP and/or i.p. immunization with irradiated 2 × 10⁶ GL-GM cells at day 5, 19 and 33, n = 30. Nontreated versus TMZ IC ***p < 0.0001. Nontreated versus TMZ IP ***p = 0.0004. TMZ IC + CD4/CD8-abs versus TMZ IC **p = 0.0014. GL-GM versus nontreated *p = 0.0119. GL-GM + TMZ IC versus nontreated ***p < 0.0001. GL-GM + TMZ IP versus nontreated *p = 0.0137. GL-GM + TMZ IC versus TMZ IP ***p = 0.0005. GL-GM + TMZ IC versus TMZ IC *p = 0.0421. GL-GM + TMZ IC versus GL-GM **p = 0.0048. GL-GM + TMZ IC versus GL-GM + TMZ IP ***p = 0.0009. Log rank test. Symptom-free survival was monitored for 100 days

