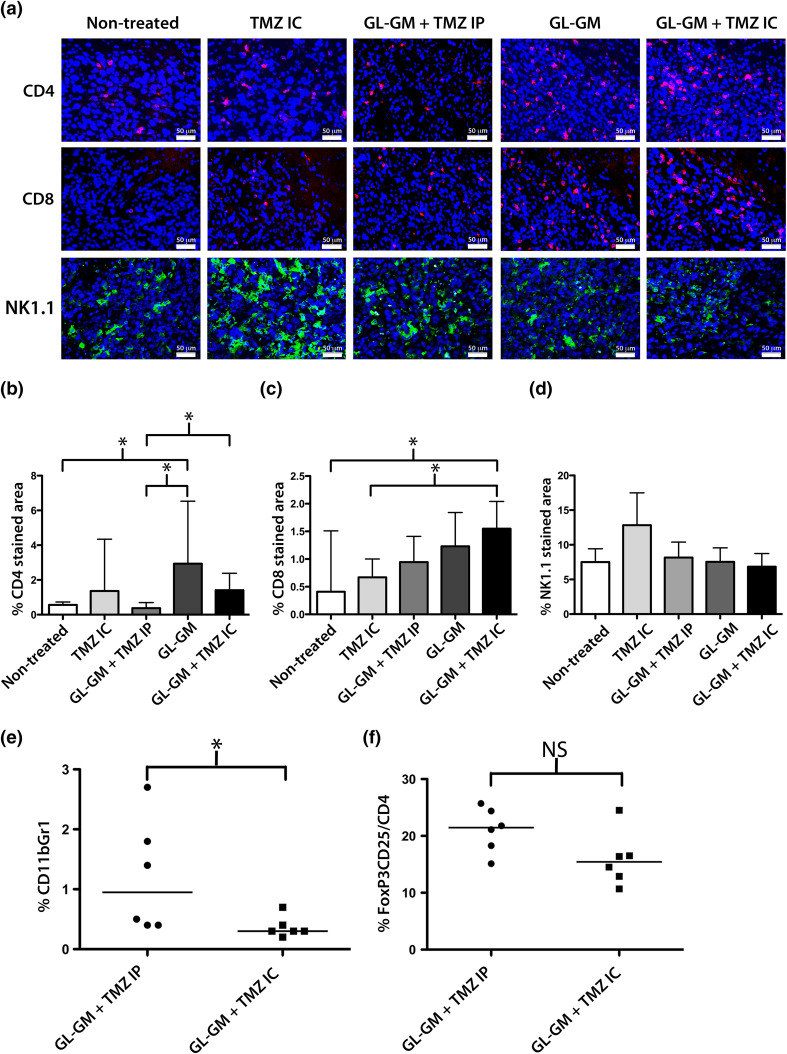
Fig. 3.
Tumor infiltrating cells of GL-GM immunized and/or TMZ-treated mice. Tumor-bearing mice (n = 3–7/group) were either nontreated, immunized with GL-GM cells on a–d day 12 or e, f day 9, and/or administered TMZ on a–d day 14–16 or e, f day 12–14 either i.p. (TMZ IP, 50 mg/kg/day) or i.c. using a micro-osmotic pump/brain infusion kit (TMZ IC, 4.2 mg/kg/day). Brain samples were collected on day 20 following tumor challenge. a–d Frozen brain sections were stained for CD4+ (red, above), CD8α+ (red, middle), or NK-1.1.+ (green, below) cells and analyzed by immunohistochemistry. a Images of representative data from one animal of each treatment: nontreated, TMZ IC, GL-GM + TMZ IP, GL-GM and GL-GM + TMZ IC. Images were taken at 20x magnification. DAPI (blue) was used as nuclear staining. Quantitative analysis of the percent of b CD4, c CD8 and d NK-1-1. Stained area of a representative tumor area (1,585,000 μm2). The medians and range for each group are shown here. Statistical differences of CD4 stained area between: Nontreated versus GL-GM *p = 0.0286; GL-GM + TMZ IP versus GL-GM *p = 0.0286; GL-GM + TMZ IP versus GL-GM + TMZ IC *p = 0.0424 or CD8 stained area between: Nontreated versus GL-GM + TMZ IC *p = 0.0424 and TMZ IC versus GL-GM + TMZ IC *p = 0.0242, nonparametric Mann–Whitney test. e, f The percentage of e MDSCs (CD11b+Gr1+) and f Tregs (FoxP3+CD25+) out of CD4+ T cells in brain samples were determined by flow cytometry. Each value and the median for each group (GL-GM + TMZ IP or GL-GM + TMZ IC) are presented here. Statistical differences between: GL-GM + TMZ IP versus GL-GM + TMZ IC: MDSCs *p = 0.0295, nonparametric Mann–Whitney U test (color figure online)

