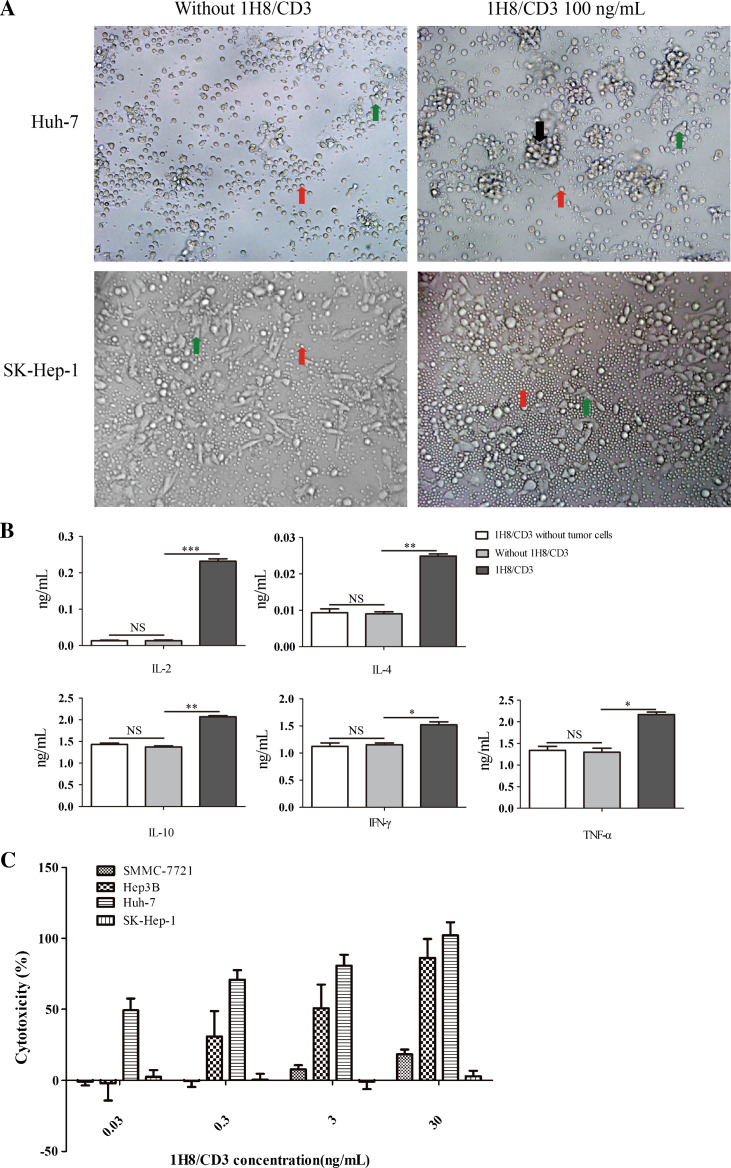
Fig. 3.
Cytotoxic activity of 1H8/CD3-engaged T cells against HCC cells. a Phase-contrast micrographs were taken 24 h after co-culture of PBMCs with a confluent monolayer of HCC Huh-7 or SK-Hep-1 cells in the presence or absence of 100 ng/ml of 1H8/CD3. Red arrows mark the position of PBMCs, green arrows mark the position of cancer cells and black arrows mark the position of PBMCs engaged around a cancer cell. b Cytokine concentrations measured by ELISA 48 h after co-culturing effector and target cells with or without 1H8/CD3, 1H8/CD3 co-culturing with PBMCs without target cells are shown. (*p < 0.05; **p < 0.01; ***p < 0.001) Data are represented as mean ± SD, n = 3. c A 1H8/CD3 dose–response assay for redirected lysis of HCC Huh-7, Hep3B, SMMC-7721 and SK-Hep-1 cells. Data are represented as mean ± SD, n = 3

