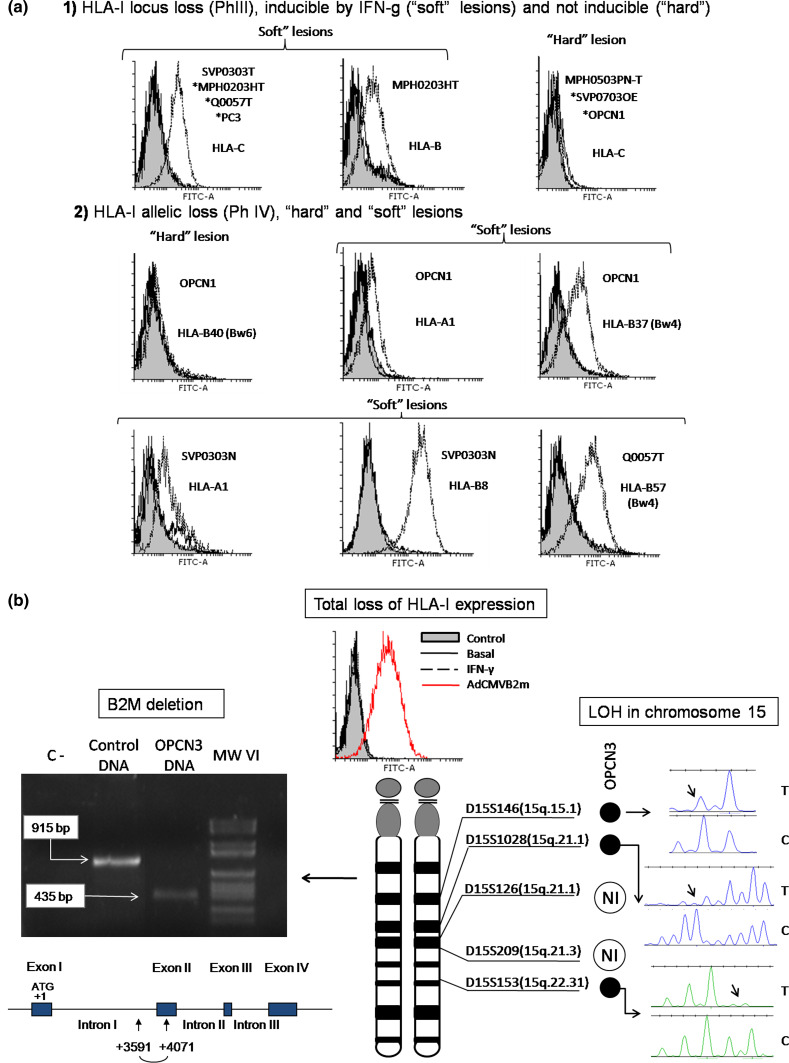
Fig. 3.
a Different patterns of HLA-I loss resistant to IFN-γ (“hard” lesions) or inducible by IFN-γ (“soft” lesions) in PC cell lines determined by FACS. (1) Irreversible locus C loss and IFN-γ-inducible downregulation of locus C and B (PhIII); (2) irreversible loss of HLA-B40 allele and IFN-γ-inducible downregulation of A1, B37, B57 and B8 (Ph IV). Gray fill—only secondary Ab control, solid line—baseline conditions, dashed line—IFN-γ treatment. mAb used: w6/32 (HLA-I/B2M complex), 421B5 (locus B), Hb122 (HLA-A3), Marb3 (Bw4 specificities) and HB152 (Bw6 specificities). b Total loss of HLA-I expression in OPCN3 cells caused by a deletion in B2M gene and LOH-15. FACS histogram demonstrating loss of HLA-I cell surface expression (w6/32 mAb) not inducible by IFN-γ. Adenovirus vector coding for human B2M gene recovers HLA-I expression. Gray fill—control; solid line—baseline expression; dotted line—IFN-γ treatment; dashed line—after AdCMVB2M transfection. PCR amplification of B2M gene fragment (including intron 1 and exon 2) using DNA from OPCN3 cells. B2M amplicon from OPCN3 cells is smaller than in control; sequencing of the amplicon showed a 480 pb microdeletion that includes the first half of exon 2 (schematic representation). Loss of heterozygosity at chromosome 15 was determined by microsatellite analysis using five specific markers flanking B2M region. (NI not informative reading). *Representative FACS histogram for several cell lines

