Fig. 3.
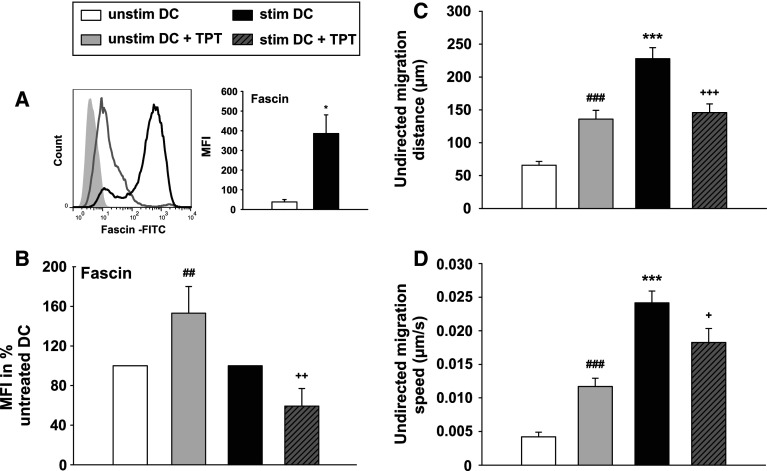
Topotecan affects the migratory properties of DCs. DCs were differentiated, stimulated, and treated with TPT as described. a Expression levels of the DC activation marker fascin were monitored by flow cytometry. (Left) The histogram shows the expression of fascin, gray line unstimulated DCs, black line: stimulated DCs, gray shaded isotype control. (Right) The graph shows the MFIs of fascin expression and represents the mean ± SEM of four independent experiments. b Relative changes in fascin expression are shown as MFIs; with the MFI of unstimulated DCs left untreated or treated with TPT, it was arbitrarily set to 100 % each. Data represent mean ± SEM of four to five independent experiments. c, d 3D collagen matrices containing 3 × 10⁵ DCs were prepared, and cell motility of the different groups in terms of (c) distance and (d) speed over ca. 6 h of observation was analyzed by time-lapse microscopy using an Olympus BX61 microscope with an UAPO lens (20x/340, NA 0.75). Transmitted light microscope images were captured every 2 min by an FView camera controlled by CellP software. c, d Data represent the mean ± SEM of three independent experiments, which is equivalent to 120 individually tracked cells per group. a–d Statistical significance *stimulated versus unstimulated DCs, and TPT-treated DCs vs. untreated DCs at unstimulated (#), and stimulated (+) state (*,+ P < 0.05, ##,++ P < 0.01, ***,###,+++ P < 0.001)

