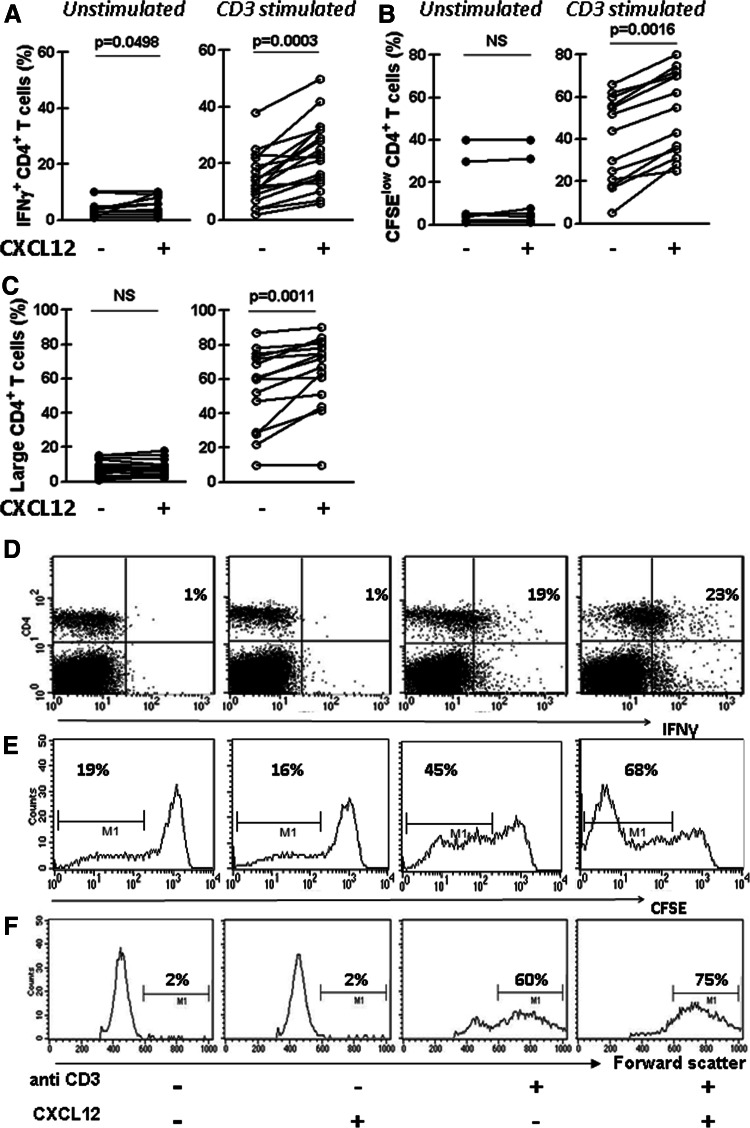
Fig. 2.
CXCL12 enhances IFNγ production and proliferation of activated CD4+ T cells from CLL patients. PBMC from CLL patients were cultured as described in Fig. 1. a After 24 h of culture, intracellular IFNγ in CD4+ T cells was analyzed by flow cytometry. The figure shows the percentage of CD4+ T cells expressing IFNγ of each patient (n = 18). b CFSE-labeled PBMC from 13 CLL patients were cultured as mentioned above, and after 5 days of culture, cells were collected, stained with specific mAb for CD4 (PerCP) and then analyzed by flow cytometry. The figure shows the percentage of CD4+ CFSElow of the total CD4+ viable lymphocytes of each patient. c PBMC from 15 CLL patients were cultured as mentioned above and after 5 days of culture CD4+ T cell enlargement was evaluated by performing a forward scatter analysis of the CD4+ cells. The figure shows the percentage of large CD4+ T cells determinate as the percentage of the total of CD4+ viable lymphocytes with forward scatter values over 600. d–f Representative dot plots for IFNγ production by CD4+ cells (d), histograms for CFSE staining in CD4+ cells (e) and for forward scatter analysis of CD4+ cells (f) are shown. The percentages of positive cells in each case are depicted. The p values for the statistical analysis with the Wilcoxon’s signed rank test are shown in the figure. NS not statistically significant

