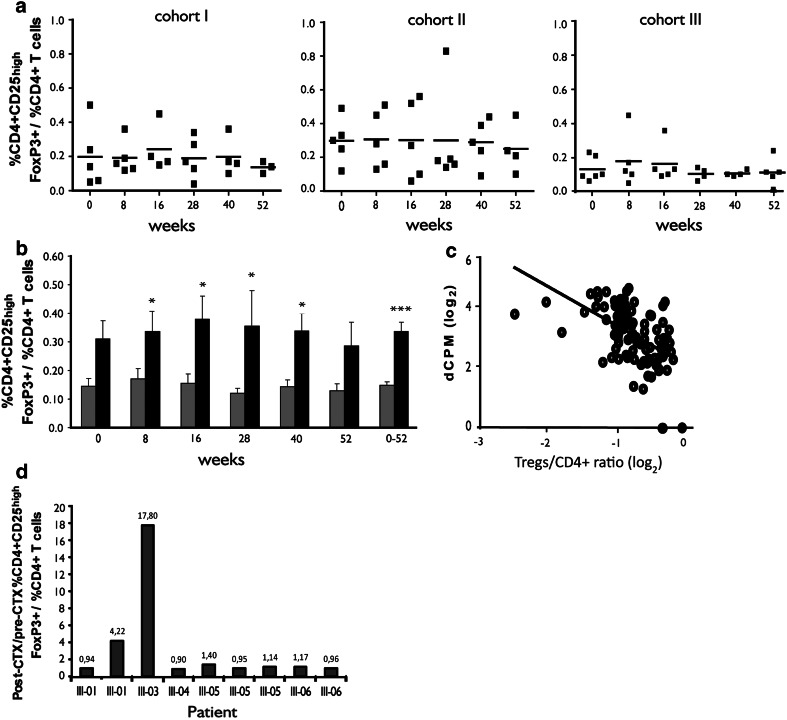
Fig. 3.
CD4+CD25highFOXP3+ T cells. a Frequency of Tregs in cohorts I, II, and III (lines represent mean values). b Immune-responding (gray columns) and immune non-responding patients (black columns) (mean ± SEM) patients, (*P < 0.05; *** P < 0.0001). c Correlation between frequency of CD4+CD25highFOXP3+ T cells and proliferation netCPM values in all the 15 vaccinated patients tested at all time points during both the 52 weeks follow-up and the maintenance vaccination follow-up (n = 109) (Pearson's r = −0.51; P < 0.0001). d. Ratio between the frequency of CD4+CD25high FOXP3+ T cells at day 10 after a CTX administration (post-CTX) and the frequency of CD4+CD25highFOXP3+ T cells prior to CTX administration (pre-CTX). Columns represent individual patients in cohort III tested at different time points (n = 9)

