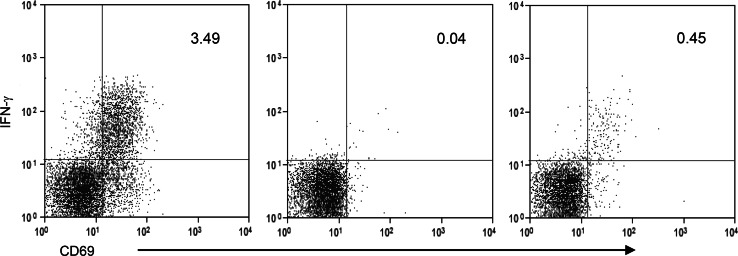
Fig. 1.
Representative dot plots depicting the method to identify CA125-specific CTL as CD8+ T cells staining positively for CD69 and IFNγ. Dot plots show CD69/IFNγ intracellular staining in CD8+ T cells stimulated with CD28/CD49d cocktail and SEB (left plot), CD28/CD49d cocktail alone (middle plot) and CD28/CD49d cocktail and CA125 (right plot). Quadstat cursors are set by visual inspection in the left plot and kept identical in the middle and right plots. The frequency of double-positive CD69/IFNγ CD8+ T cells is reported in the upper right quadrant in each plot

