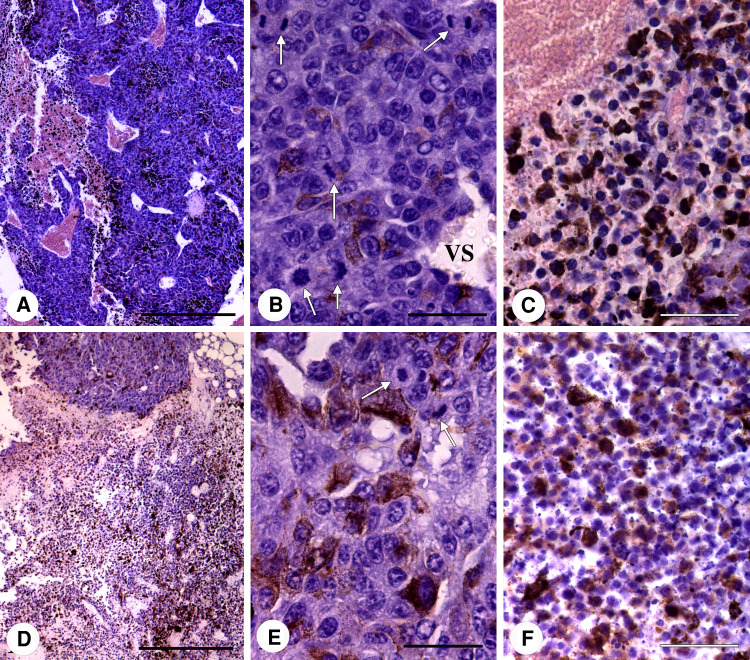
Fig. 6.
Representative images of the untreated (a–c) and immunotoxin-treated melanomas (d–f). a An untreated tumour shows large living tumour cell areas and a few necrotic-haemorrhagic zones. b Living tumour cells with large vesicular nuclei, prominent nucleoli and a relatively dense cytoplasm. White arrows: mitoses. VS: vascular space surrounded by tumour cells. c Necrotic area with cells undergoing different degrees of destruction. d In immunotoxin-treated tumours, the living tumour cell areas are smaller than the predominant necrotic-haemorrhagic zones. e The living tumour cells of treated tumours are similar to those of the untreated tumours but with a lower degree of mitosis. f Necrotic-haemorrhagic zone of a treated tumour showing necrotic cells, melanin granules and basophilic bodies (arrows). Scale bar 500 μm (a, d) or 50 μm (b, c, e, f)

